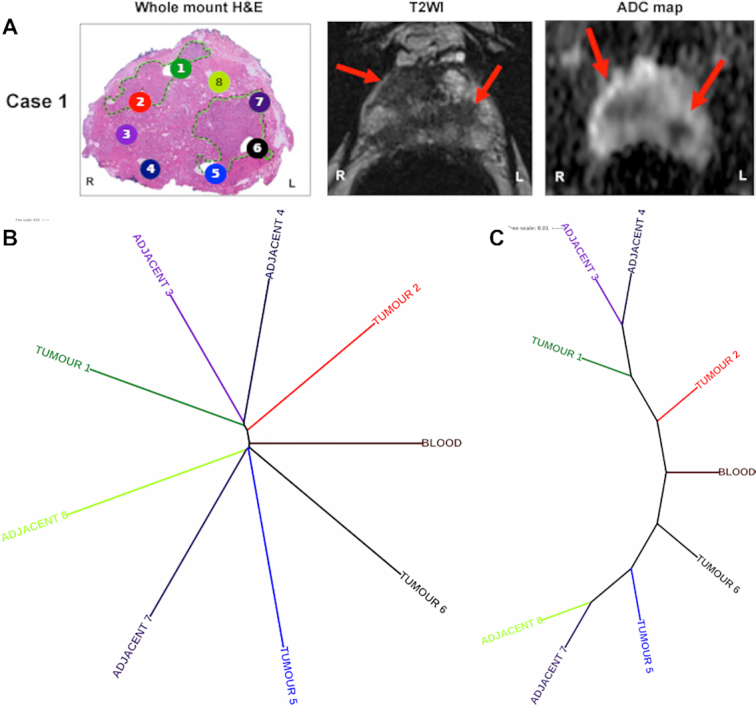
Figure 1.

Multi-regional sampling WES to asses intra-patient heterogeneity with NUQA. (A) Patient case 1’s coloured cores in their haematoxylin and eosin whole-mount sections [adapted from (22)], as well as their associated axial T2-weighted image and apparent diffusion coefficient maps that align with the phylogenetic tree from NUQA. The patient’s magnetic resonance imaging (MRI) scans show visible tumour sites on both sides of the prostate, indicated by red arrows as annotations. (B) Phylogenetic tree from NUQA that adheres to branch lengths of the tree to show the calculated distance between samples, and the tree produced when these branch lengths are ignored to highlight their ordering and clustering (C).
