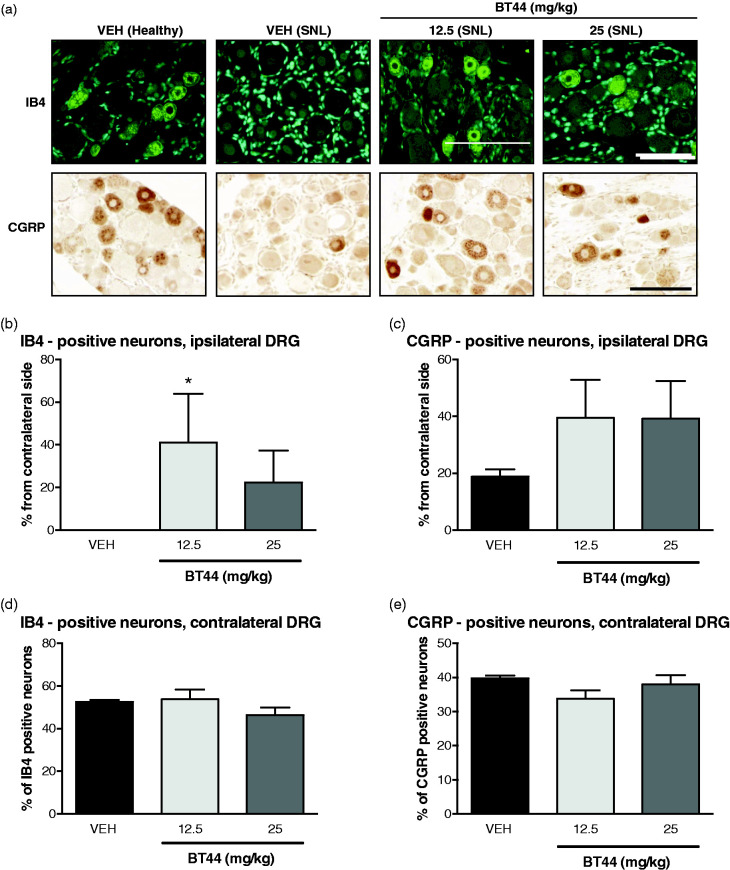
Figure 7.
Expression of neuronal markers in DRGs of SNL animals treated with BT44. Representative images of IB4 and CGRP—probed DRG sections (a). The number of marker-specific neurons in ipsilateral DRGs was calculated as a percentage of the total number of neurons for each section (two to four per DRG), the data for each DRG were averaged and normalized to the data for the contralateral DRG to reduce interindividual variation (b and c). The number of marker-specific neurons in contralateral DRGs (d and e) was expressed as percentage from total number of neurons. Data represent means ± SEM. *P < 0.05 (Kruskall–Wallis with Dunn’s multiple comparison post hoc test; reference: the corresponding vehicle-group without BT44 treatment). n = 3–5 animals per group. VEH: vehicle. Scale bar = 100 µM.

