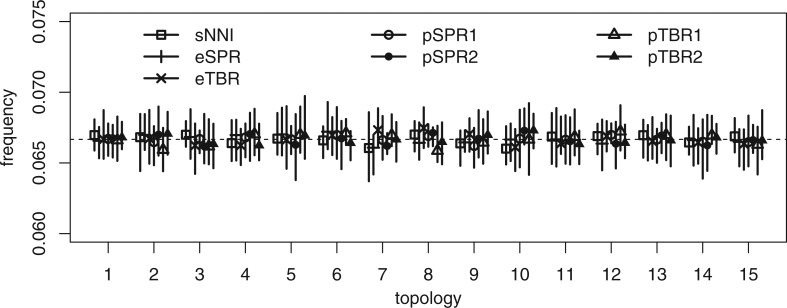
Figure 3.
Test of the ability of the tree proposals to retrieve a uniform prior over topologies without data. We used a tree with five tips and a constant likelihood. The estimated posterior probabilities are represented as the mean (dot) and range (bar) across 10 replicate analyses. The prior probability is  represented as horizontal dashed line. Topology 1 is the true tree (Fig. 2a) and topology 2 is the LBA tree (Fig. 2b).

