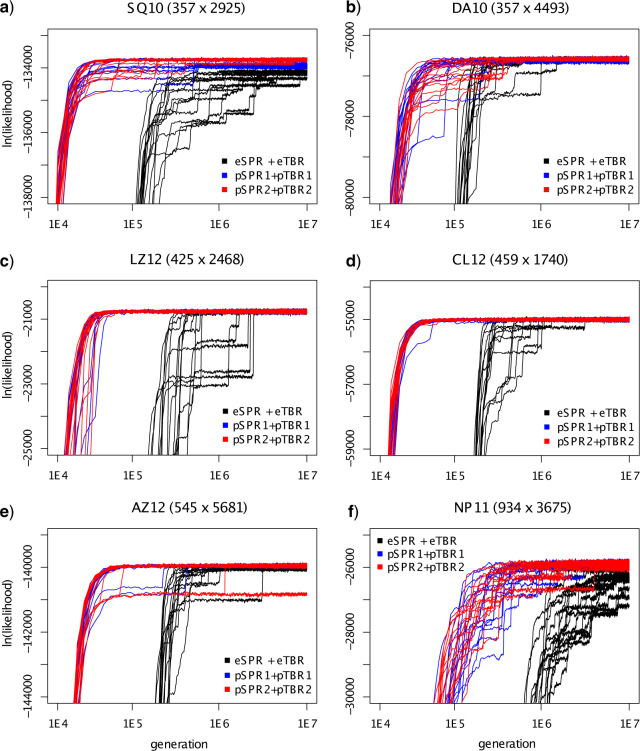
Figure 6.
Performance of three different tree proposal combinations—eSPR + eTBR (black), pSPR1 + pTBR1 (blue), and pSPR2 + pTBR2 (red)—on the six data sets (a–f) for which we had good reference samples from the posterior. We show the likelihood trace plots for 16 individual single-chain runs for each proposal combination. Note that all axes are in log scale. The trace plots corresponding to the last 5 million generations are shown in Supplementary Figure S1 available on Dryad.

