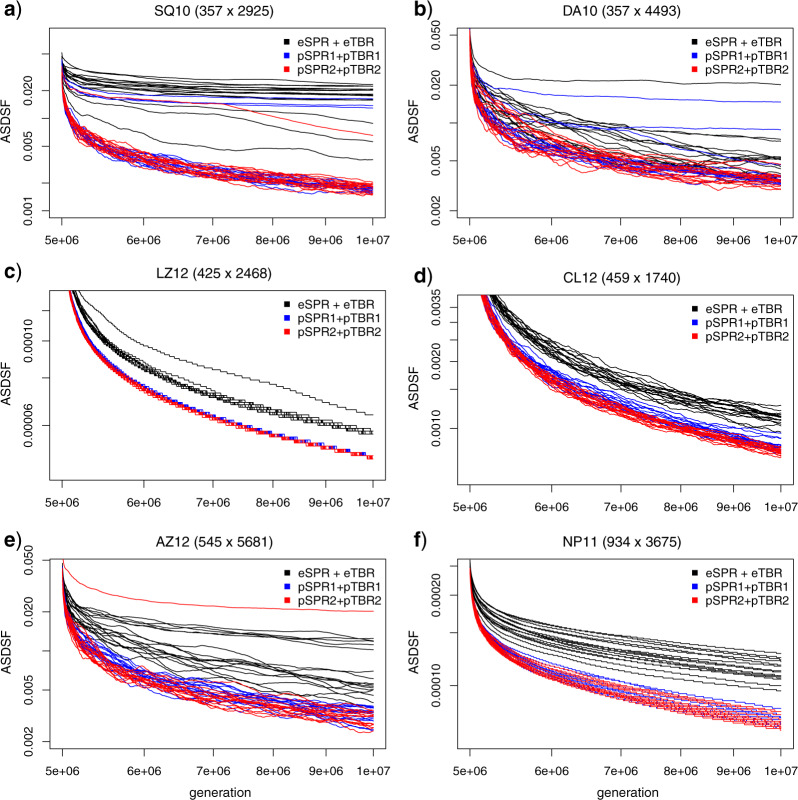
Figure 8.
Mixing behavior of three different tree proposal combinations—eSPR + eTBR (black), pSPR1 + pTBR1 (blue), and pSPR2 + pTBR2 (red)—on the six data sets (a–f) for which we had good reference samples from the posterior. We show the convergence toward the reference sample of topologies as indicated by the ASDSF diagnostic for 16 individual single-chain runs for each proposal combination. The plots correspond to the last 5 million generations of the runs shown in Figure 7, that is, the last 10% of the x-axis there. Thus, each run started from a tree with high posterior probability, and the rate at which the ASDSF drops represents the speed with which the chains cover the posterior. Note that all axes are in log scale.

