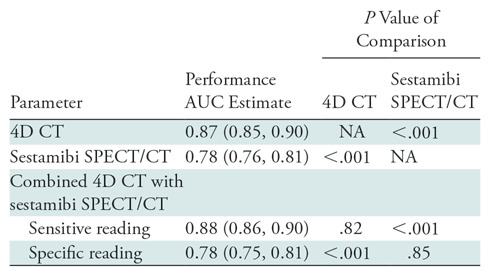
Table 3:
Comparison of Areas Under the Curve

Note.—Data in parentheses are 95% confidence intervals. Area under the receiver operating characteristic curve comparisons for correlated receiver operating characteristic curves were performed by using Hanley and McNeil (14). Area under the curve analyses were performed by using a per-lesion, four-quadrant analysis in 1600 glands. 4D = four dimensional, AUC = area under the receiver operating characteristic curve, NA = not applicable.
