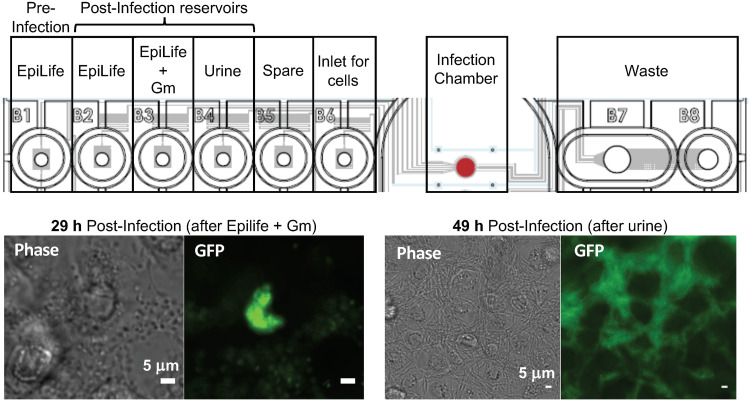
FIG 1.
Microfluidic model for the intracellular UPEC and release stages of UTI. Diagrammatic representation of the CellASIC Onix microfluidics plate showing the contents of each well that were sequentially pumped through the main chamber during the defined stages of the infection. The lower panels show phase-contrast and fluorescence microscopy images of the infection chamber surface at the end of the intracellular growth stage (29 h postinfection), showing a well-developed IBC, and at the end of the dispersal phase (49 h postinfection), showing filamentous UTI89/pGI5 in among BECs. Scale bars, 5 μm.

