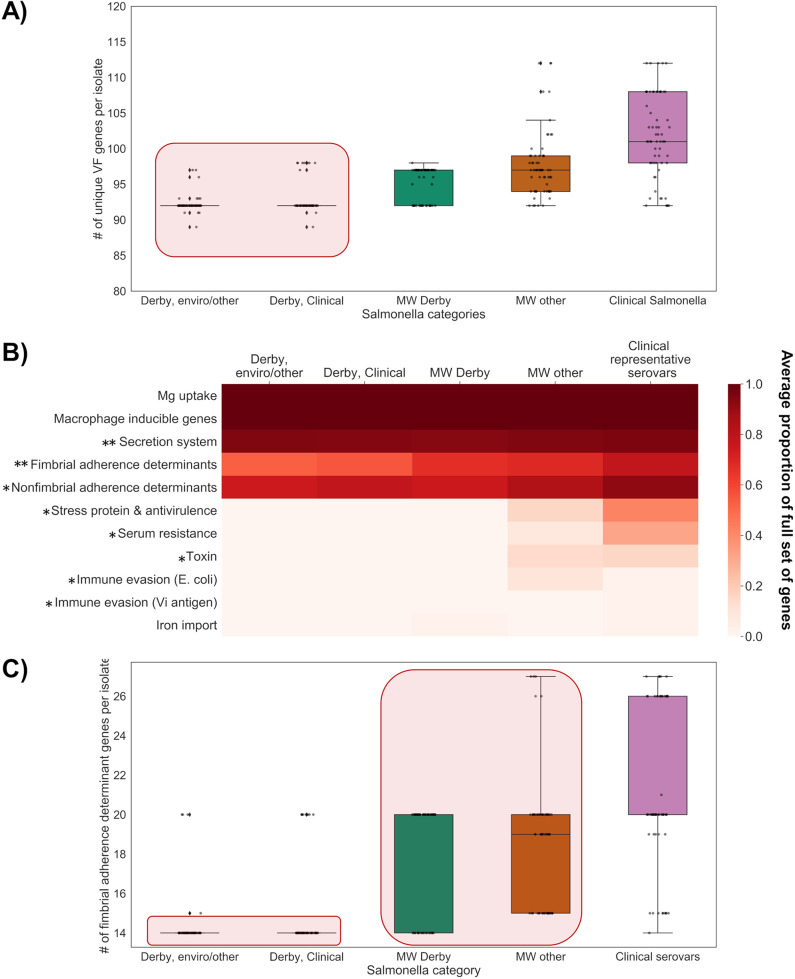
FIG 1.
VF gene variation in subsampled Salmonella categories (ABRIcate against VFDB with 70% coverage and 90% identity). (A) Box plot with overlaid strip plot showing unique VF genes per isolate. The strip plot (black dots) indicate results from individual isolates within each group. The red rectangle indicates pair which did not have significant differences in VF gene frequencies (null hypothesis accepted for χ2 post hoc test, α = 0.05 with Bonferroni correction for multiple comparisons). (B) Heat map of VF gene frequency (grouped by functionality [54]). Asterisks indicate gene functional categories with significant omnibus tests at an α value of 0.05 (one asterisk for Fisher’s exact test and two asterisks for χ2 test of independence). (C) Box plots with overlaid strip plots for fimbrial determinant genes per isolate in different Salmonella categories. Red rectangles indicate pairs which did not have significant differences in VF gene frequencies (null hypothesis accepted).

