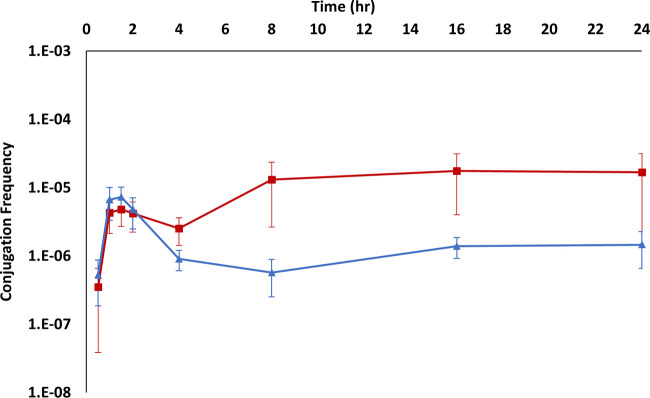
FIG 2.
Average conjugation frequency in growing cultures. The red line represents LB cultures (no antibiotics), and the blue line represents LB+CFX (25 μg/ml) cultures. Error bars represent standard deviations. The major increases and decreases in conjugation are statistically significant (i.e., 0.5 h versus 1 h, 2 h versus 4 h, and 4 h versus 8 h) for both cultures. P values for comparisons of adjacent time points on the same line and different time points between lines can be found in Table S1.

