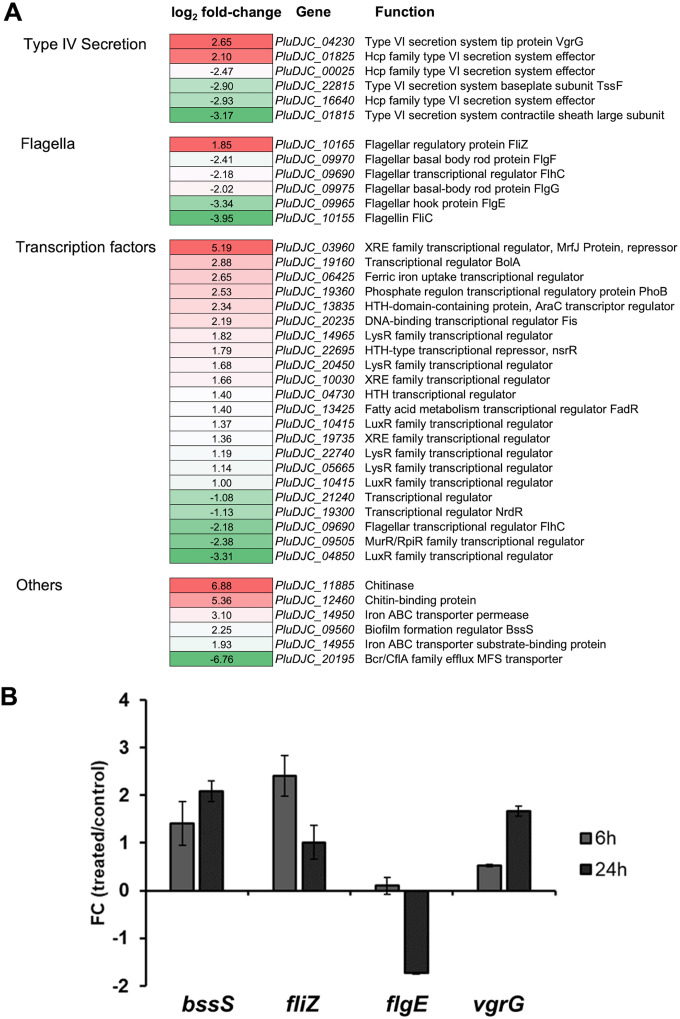
FIG 2.
(A) DEGs of P. luminescens 2° cells in response to pea root exudates. Subset of P. luminescens 2° DEGs that showed modulated expression in response to root exudates from Pisum sativum variant Arvica. The first column represents the different gene classes. The second column shows the relative gene expression level (−1 ≤ log2 fold change ≥ 1; P ≤ 0.05) of P. luminescens 2° cells cultivated with root exudates in comparison to that of those cultivated in the absence of the exudates. The third column describes the gene names and their putative function. Red represents upregulation, whereas green denotes downregulation of gene expression. (B) Real-time qPCR considering selected P. luminescens 2° DEGs to confirm the RNA-seq data analysis. The plot shows the fold change (FC) (P. luminescens 2° cells in LB with pea plant root exudates [“treated”]/P. luminescens 2° cells in LB [“control”]) expression level of the following selected genes of interest: PluDJC_09560 (bssS), PluDJC_10165 (fliZ), PluDJC_09965 (flgE), and PluDJC_04230 (vgrG). The analysis was performed at 6 h (gray) and 24 h (dark gray) postinoculation of the cells. Error bars represent standard deviation of at least three independently performed biological experiments.

