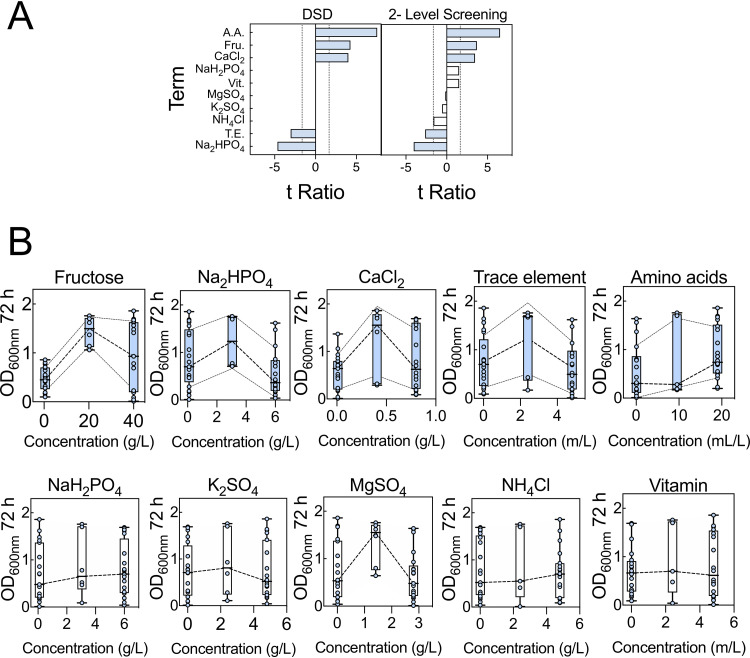
FIG 2.
Definitive screening design array analysis. (A) Definitive screening and 2-level screening of data within DSD1 were performed. The comparative lengths of the t ratios for each factor and factor interaction are shown. At high concentrations, bars extending to the right have a positive impact on growth, while those extending to the left have a negative impact on growth. Terms deemed significant for model projection are shaded (blue). Abbreviations: Fru., fructose; T.E., trace element mixture; A.A., amino acid mixture; Vit., vitamin mixture. The broken vertical lines indicate threshold (t < −1.65 or t > 1.65) level at 90% confidence level. (B) Summary of main effect plot for each factor. The middle broken lines are connecting mean growth for each factor settings. Additionally, for significant factors, the broken lines above and below that of the mean growth are standard deviation bands. Error bars indicate SEMs. Analysis is based on two biological replicated arrays (Table S2).

