
Figure 1.
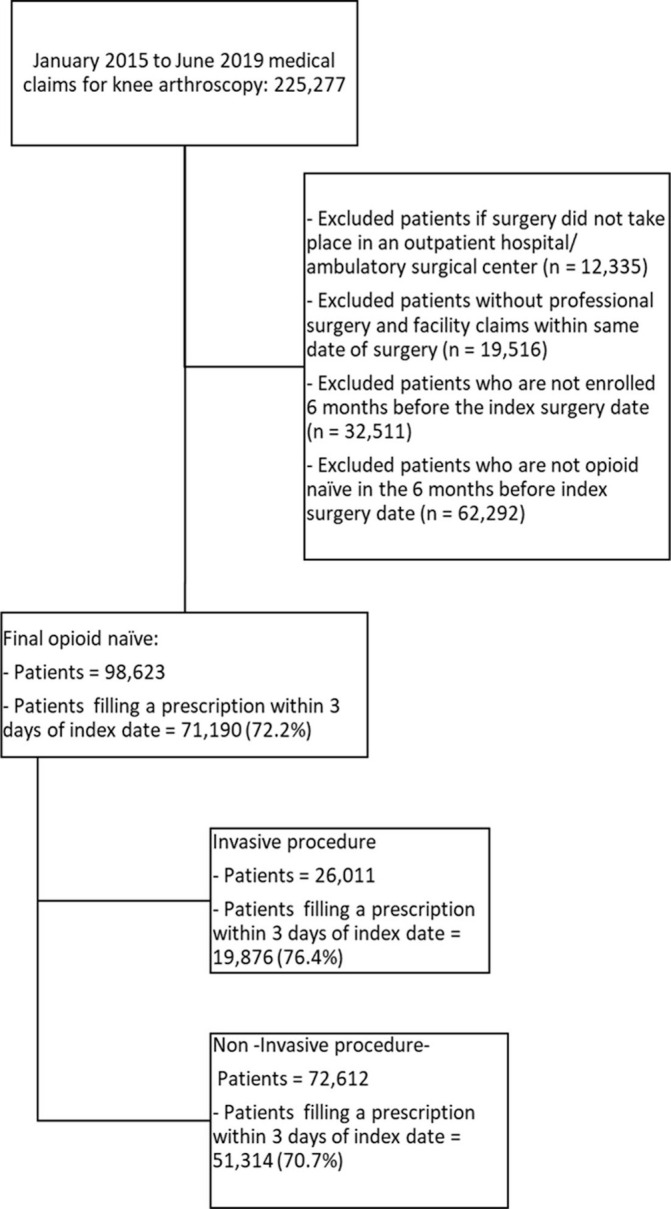
Flow chart of Sample. It displays the flow chart from the full sample that leads to our final sample after sample exclusion restrictions.
Official websites use .gov
A
.gov website belongs to an official
government organization in the United States.
Secure .gov websites use HTTPS
A lock (
) or https:// means you've safely
connected to the .gov website. Share sensitive
information only on official, secure websites.
Flow chart of Sample. It displays the flow chart from the full sample that leads to our final sample after sample exclusion restrictions.