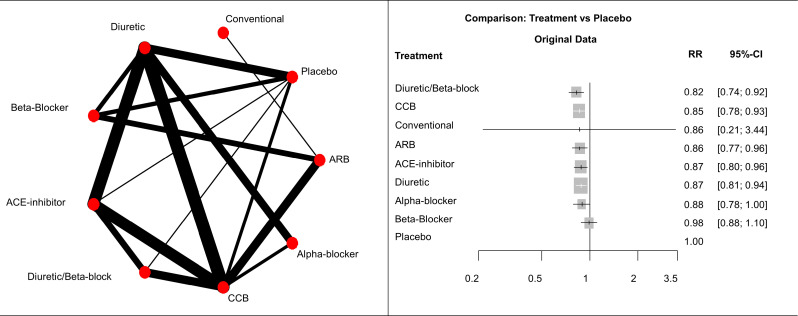
Figure 1.
(Left panel) Network graph of network of nine antihypertensive treatments for primary prevention of cardiovascular disease. Line width is proportional to inverse standard error of random effects model comparing two treatments. (Right panel) Forest plots of relative treatment effects of overall mortality for each treatment versus placebo. ACE, Angiotensin Converting Enzyme; ARB, angiotensin receptor blockers; CCB, calcium channelblockers; RR, risk ratio.

