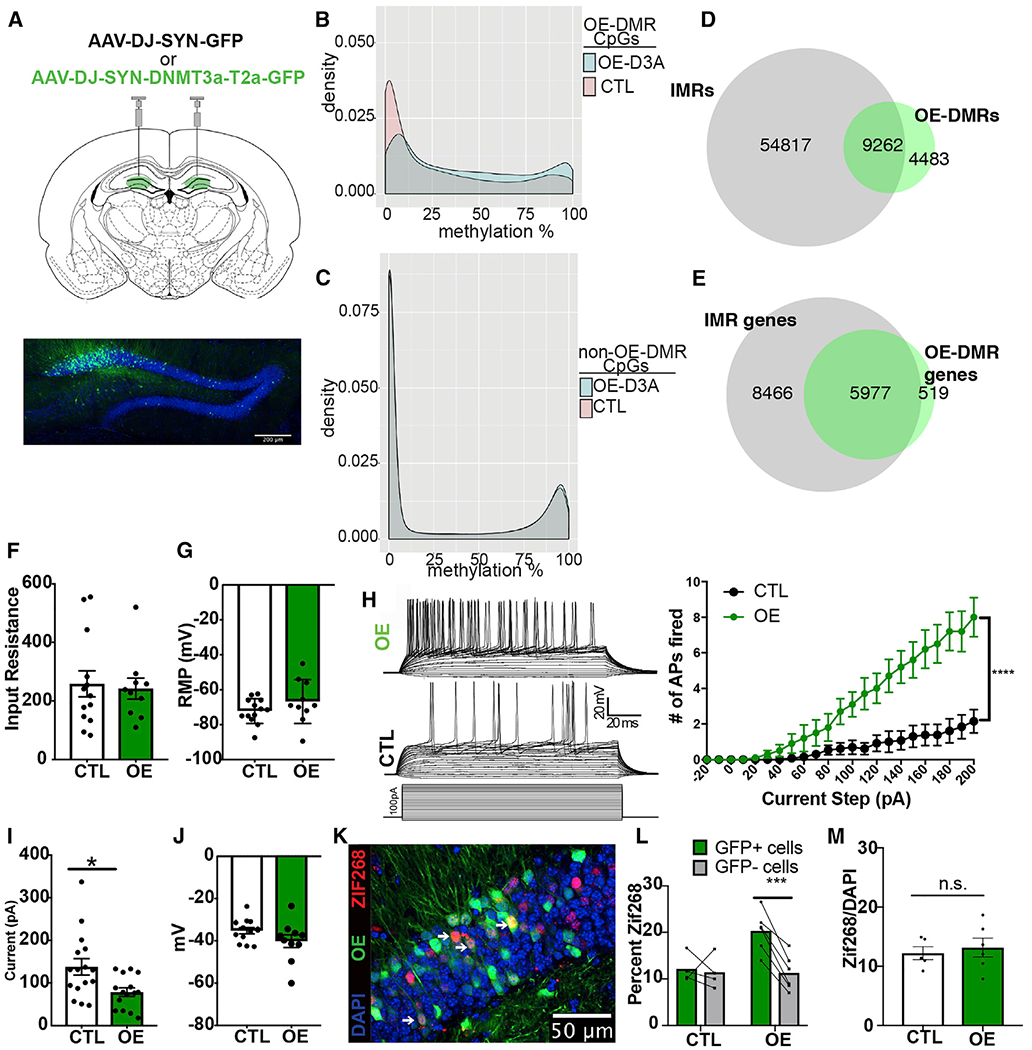
Figure 4. DNMT3A OE in DGCs Increases Methylation at a Subset of IMRs and Enhances Intrinsic Excitability.

(A) Injection of DNMT3A OE of AAV-DJ-SYN-DNMT3A-T2a-GFP and control AAV-DJ-SYN-GFP into the dDG bilaterally (scale bar, 200 μm).
(B) Distribution of methylation levels of CpG sites at OE-DMRs.
(C) Distribution of methylation levels at CpG sites with no significant methylation change in OE neurons.
(D) OE-DMR and OE-IMR overlap.
(E) OE-DMR-containing genes are IMR genes.
(F) Input resistance of OE and control GFP+ DGCs in slices (t = 0.2783, p = 0.7835; n = OE, 10 cells/6 animals; control, 13 cells/7 animals). Data are mean ± SEM.
(G) Resting potential of OE and control GFP+ cells (t = 1.316, p = 0.2023). Data are mean ± SEM.
(H) Evoked action potentials in OE and control cells across a depolarizing current injection curve while cells are held at −70 mV. Representative traces from an OE and a control cell are at the left top and middle; current step protocol is at the left bottom. Graphical representation of the data is on the right. Two-way ANOVA genotype × pA, F(22,462) = 15.10, p < 0.0001; genotype, F(1,21) = 14.85, ***p = 0.0009; n = OE, 10 cells/6 animals, control, 15 cells/8 animals. Data are mean ± SEM.
(I) Rheobase in OE compared with control cells (Welch corrected, t = 2.754, *p = 0.0114). Data are mean ± SEM.
(J) Membrane potential at the occurrence of the first spike during current injection in OE and control neurons (t = 1.573, p = 0.1306). Data are mean ± SEM.
(K) Representative immunohistochemistry image of dDG of mice after 15 min of novel environment exploration. White arrows indicate OE and ZIF268 colabeled cells (scale bar, 50 μm).
(L) ZIF268+ positivity counts in GFP+ versus GFP− neurons. Two-way ANOVA GFP3×experimental group, F(1,8) = 10.95, p = 0.0107; FOS+ versus FOS− in OE and control groups, adjusted ***p = 0.0009 and 0.9182, respectively; n = 6 OE, 4 control, 2–4 sections per animal.
(M) Total recruitment in control and OE DGCs after novel environment exploration (t = 0.426 p = 0.6477, n = 5, 6). Data are mean ± SEM.
