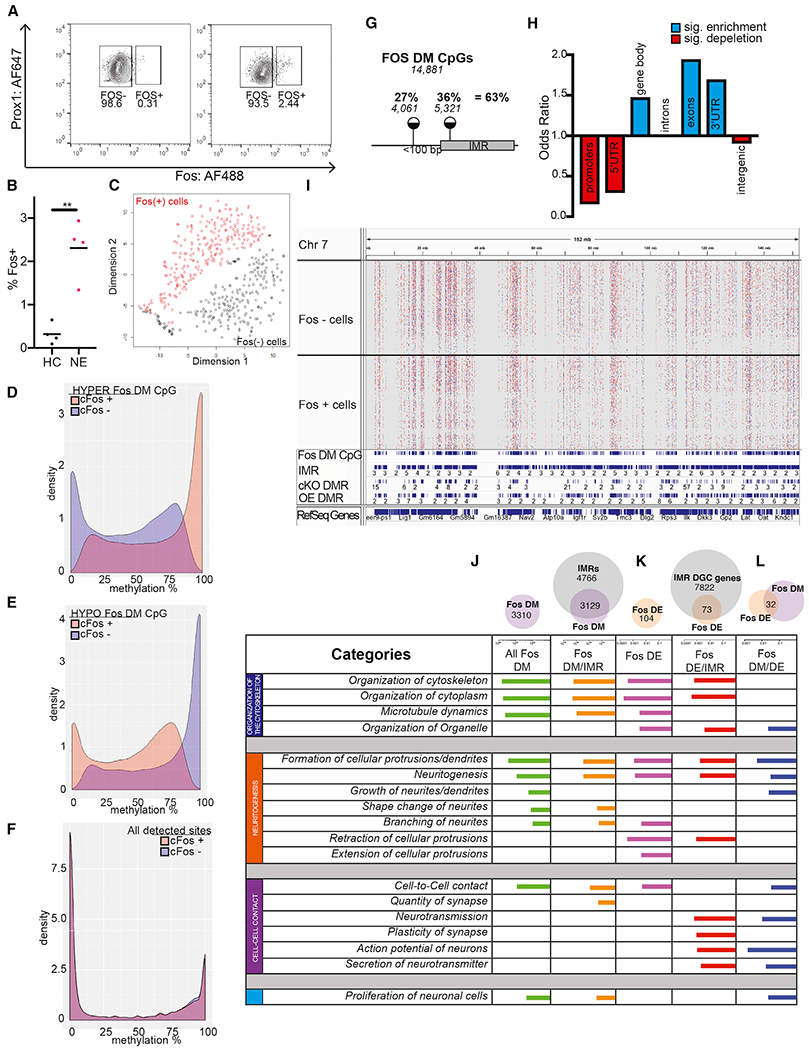
Figure 5. sn-Methylomes of Activated DGCs Reveal DM CpGs that Exhibit IM, Map to Developmental IMRs, and Are Associated with Specific Neuronal Gene Functions.

(A) Representative FACS plots showing the proportion of FOS+ nuclei in the population of PROX+ DGCs in a home cage and after novel environment exposure.
(B) Proportion of FOS+ nuclei is increased by novel environment exposure. Four independent experiments (Welch corrected, t = 5.504, **p = 0.0066, n = 2–4 mice per group/experiment).
(C) t-SNE plot of FOS-DM CpG sites shows the separation of FOS+ and FOS− nuclei.
(D and E) DM CpGs between FOS+ and FOS− cells, identified by snRRBS, exhibit IM across the entire 0% to 100% range. About half of FOS-DM CpGs are hypermethylated in FOS+ (D), whereas the other half are hypomethylated in FOS+ (E).
(F) Bimodal distribution of methylation levels at non-DM (~1.2 million) CpGs in FOS− and FOS+ DGCs.
(G) Around 1/3rd of DM CpGs between FOS+ and FOS− cells mapped to IMRs, whereas an additional 1/4th were near IMRs.
(H) Enrichment of IMRs in genomic features.
(I) Distribution of DMCpGs within a representative 150 Mb region of chromosome 7 (Chr7) in 233 FOS− cells (upper tracks) and 264 FOS+ cells (lower tracks). Red, hypermethylated, and blue, hypomethylated, in FOS+ versus FOS− cells. The IGV track of aggregate sn-methylomes is also displayed below the single-cell tracks. FOS-DM CpGs tend to accumulate at regions occupied by IMRs, cKO-DMRs, and OE-IMRs.
(J–L) sn-Methylomes and transcriptomes of activated DGCs reveal common functional gene ontologies. Ingenuity molecular and cellular functions associated with DM (J), DE (K), and both DM and DE (L) genes between FOS+ and FOS− cells (IPA). Top ten functions are displayed based on BH-corrected p values.
See also Figures S3 and S4.
