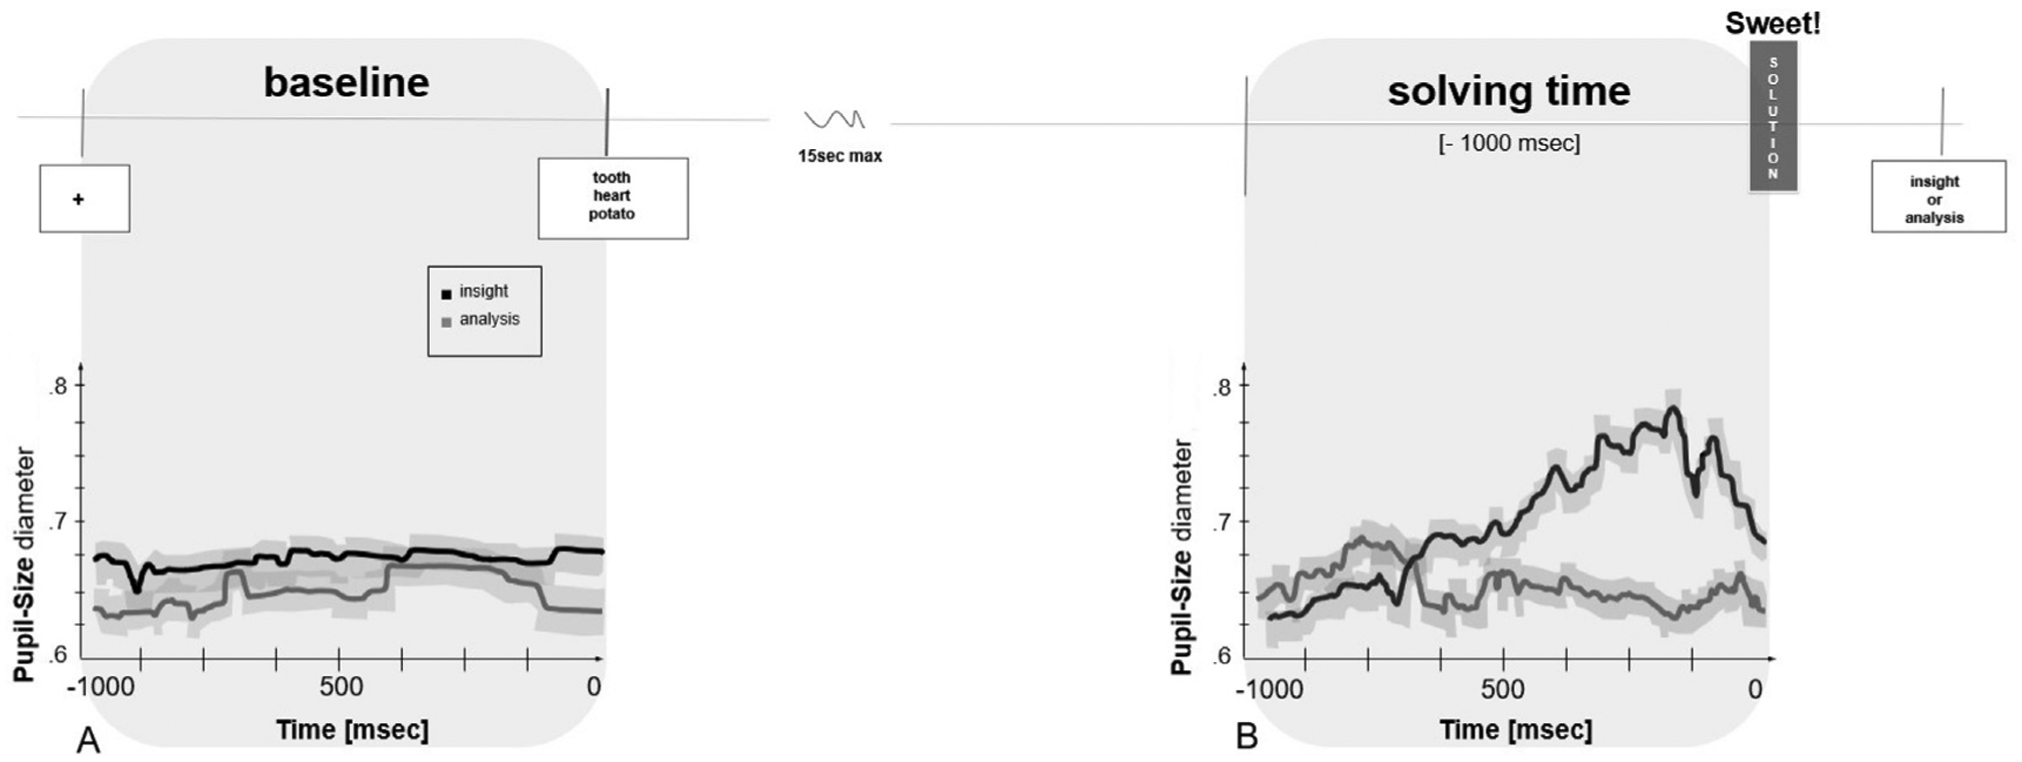
Fig. 1.

(A) Average fluctuation of pupil dilation/constriction across problems following solved via insight versus via analysis (black line and gray line respectively), within a 1-sec temporal window at fixation, preceding the appearance of the problem. (B) Average fluctuation of pupil dilation/constriction preceding the solution time (1000 msec before the button press) across problems solved via insight and via analysis (black line and gray line respectively). Thick lines denote means over participants, gray shadows represent the standard errors. Data include all the attempted problems (correct/incorrect, insight/analysis).
