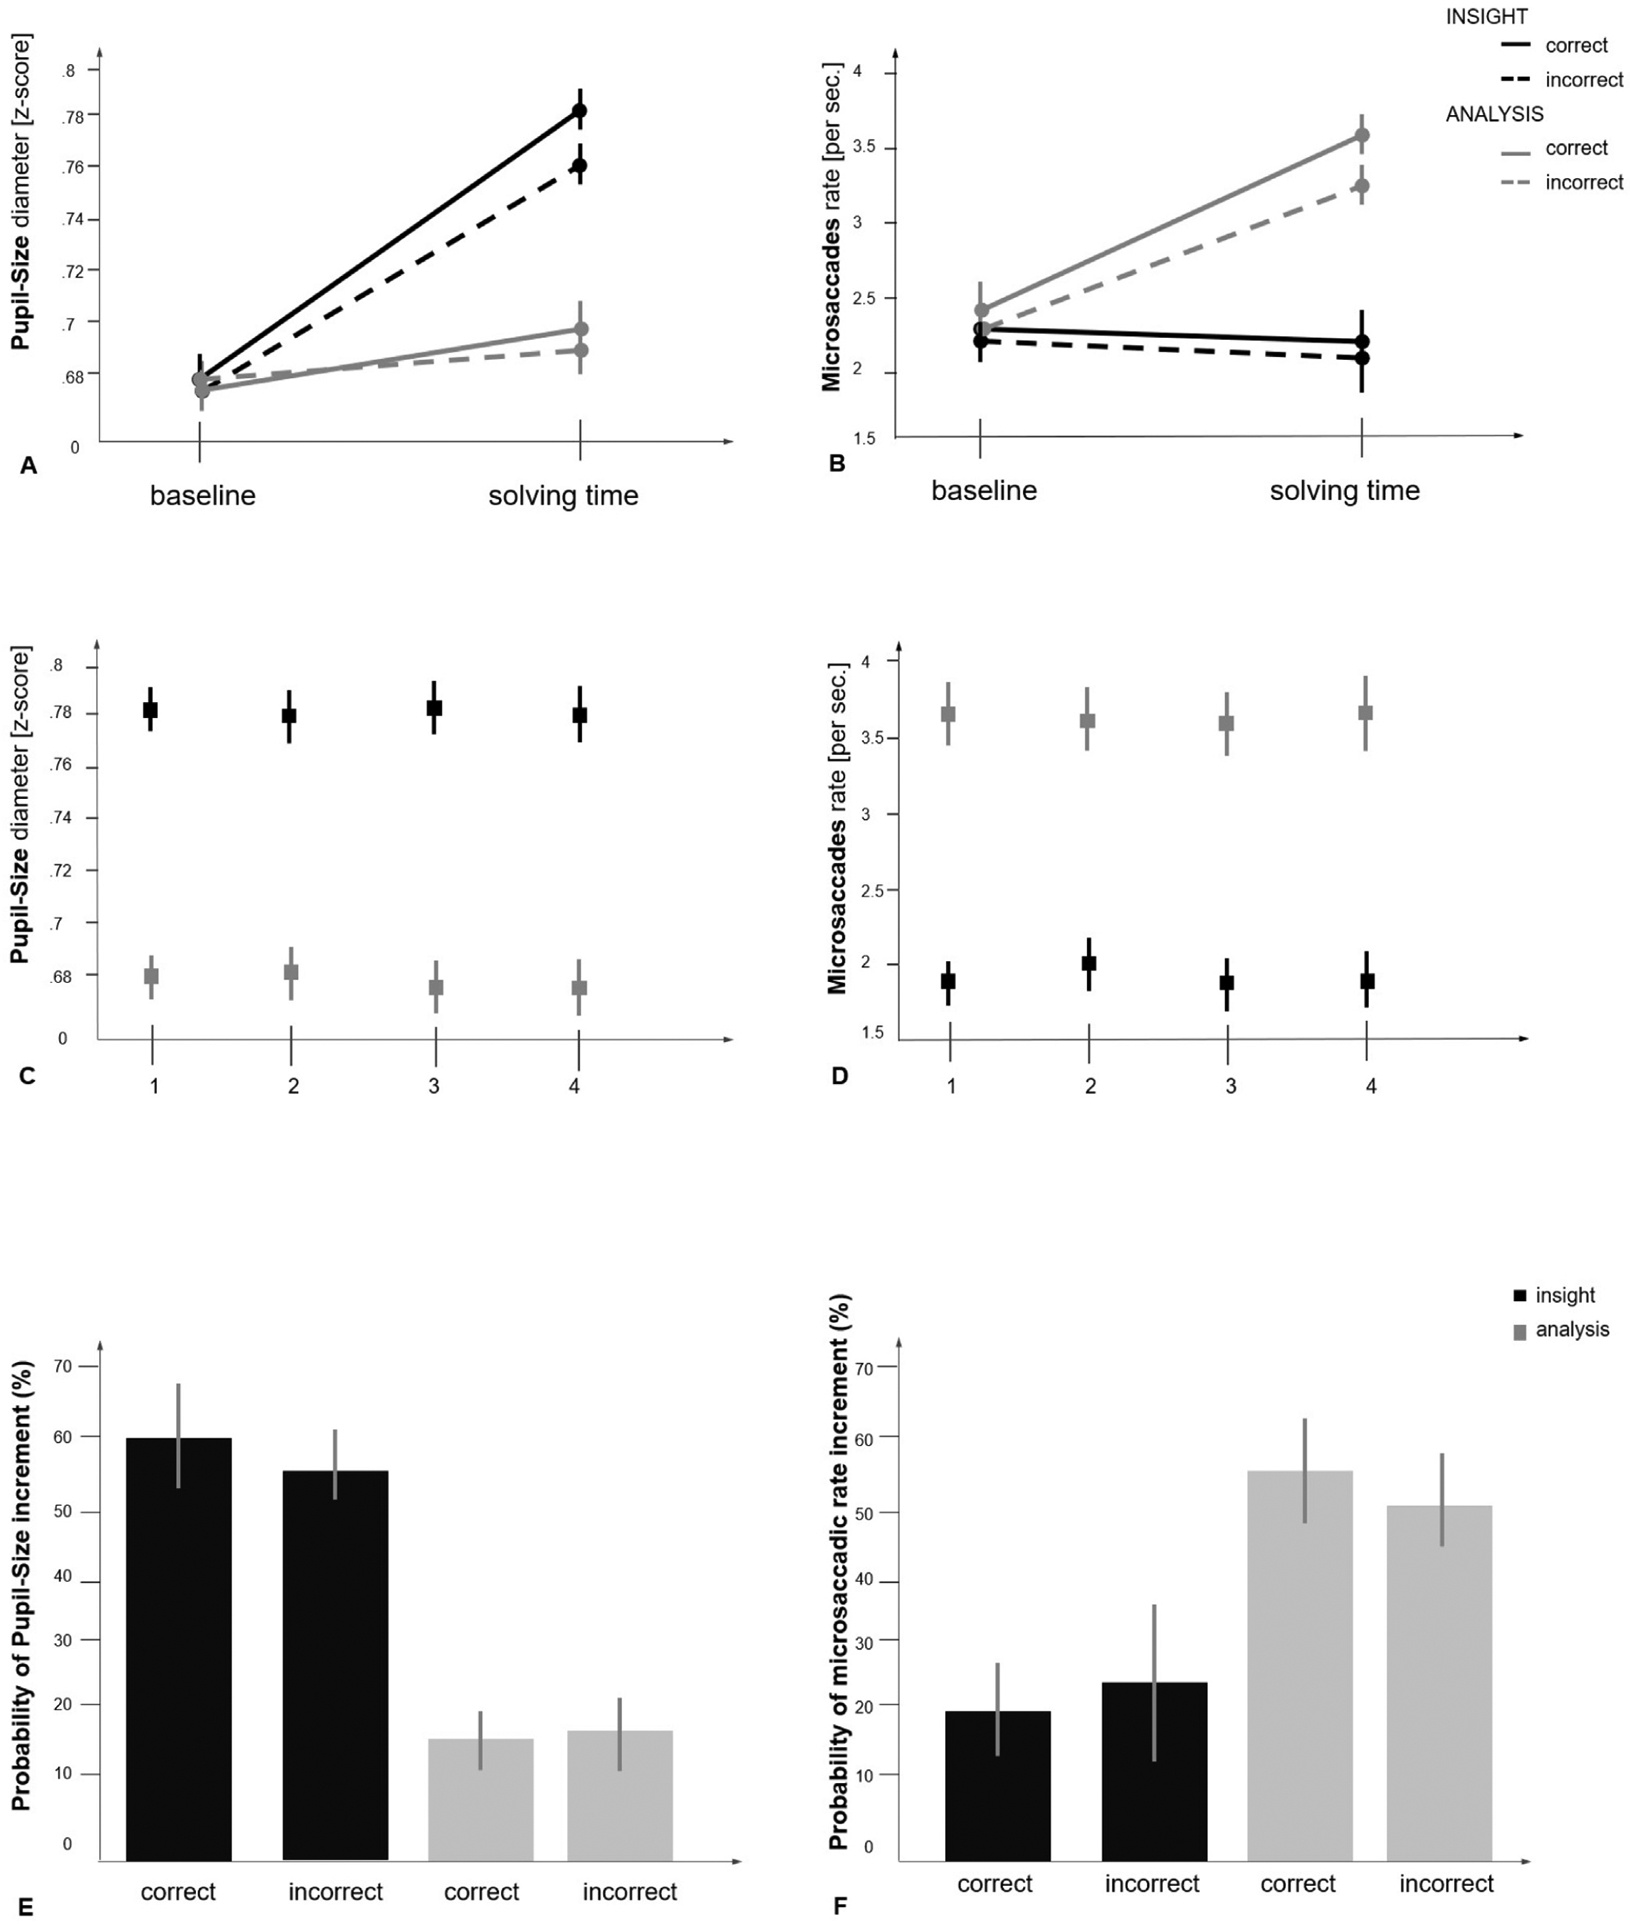
Fig. 2.

Graph A shows the average and standard error of pupil diameter at the baseline and at the solving time (1000 msec before problem-solving), within problems solved correctly and incorrectly, via insight and via analysis (respectively in black and gray). Graph B shows the average and standard error of microsaccadic rate at the baseline and at the solving time (1000 msec before problem-solving) within problems solved correctly and incorrectly via insight and via analysis (respectively in black and gray). Graph C shows the average and standard error of pupil diameter for problems solved via insight and via analysis across the four experimental blocks. No significant difference across the blocks was found (respectively in black and gray). Graph D shows the average and standard error of microsaccadic rate for problems solved via insight and via analysis across the four experimental blocks. No significant difference across the blocks was found (respectively in black and gray). Graph E shows the probability of pupil size increment across problems solved correctly and incorrectly via insight and via analysis (respectively in black and gray). Graph F shows probability of microsaccadic increment across problems solved correctly and incorrectly via insight and via analysis (respectively in black and gray).
