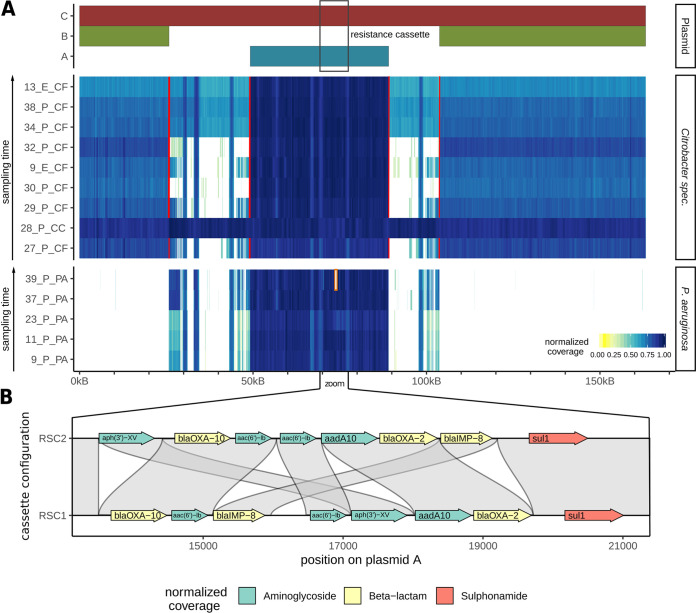
FIG 4.
(A) Coverage plot based on short-read Illumina data mapped against reference plasmid C found in C. cronae. Plasmid C (red bar) comprises of the sequences of plasmids A (blue bar) and B (green bar) fused by two transposon-rich regions. Red lines indicate breakpoints, which are characterized by the absence of reads spanning the breakpoint. White areas indicate the absence of coverage and hence the absence of sequence in a given isolate, which in some cases could have been the result of a deletion event or might indicate boundaries between scaffolds. (B) Comparison of the resistance gene cassette configurations of RSC1 and RSC2, showing putative AMR gene translocation events and a deletion of qacH.

