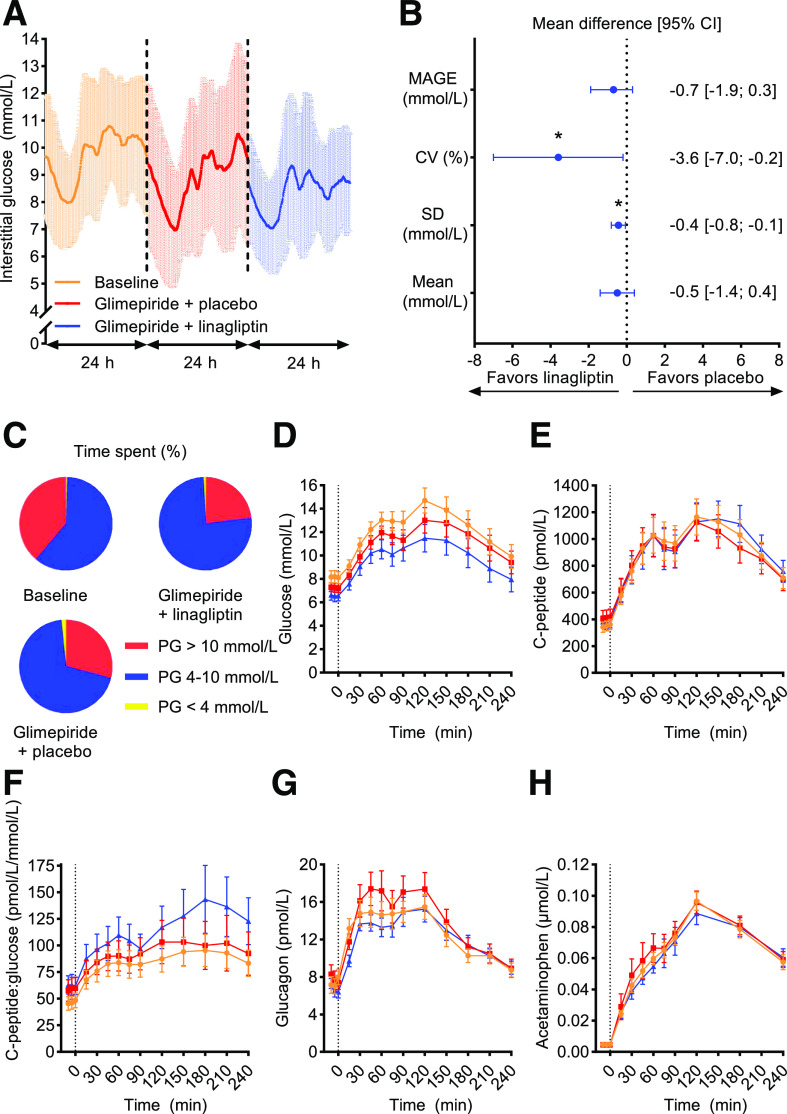
Figure 1.
CGM and meal and bicycle test. A: Mean ± SD values from CGM during 24 h at baseline and at the end of two 16-week treatment periods of glimepiride + linagliptin and glimepiride + placebo in 19 patients with HNF1A diabetes. B: Differences in means and 95% CI in glycemic variability calculated from CGM data between glimepiride + linagliptin and glimepiride + placebo. C: Mean percent time spent in different plasma glucose (PG) ranges, calculated from CGM. D–H: Combined meal and bicycle test concentration versus time for plasma/serum glucose (D), C-peptide (E), C-peptide–to–glucose ratio (F), glucagon (G), and acetaminophen (H). Graphics data are mean ± SEM if not otherwise indicated. Orange circle, baseline; red square, glimepiride + placebo; blue triangle, glimepiride + linagliptin. *P < 0.05.

