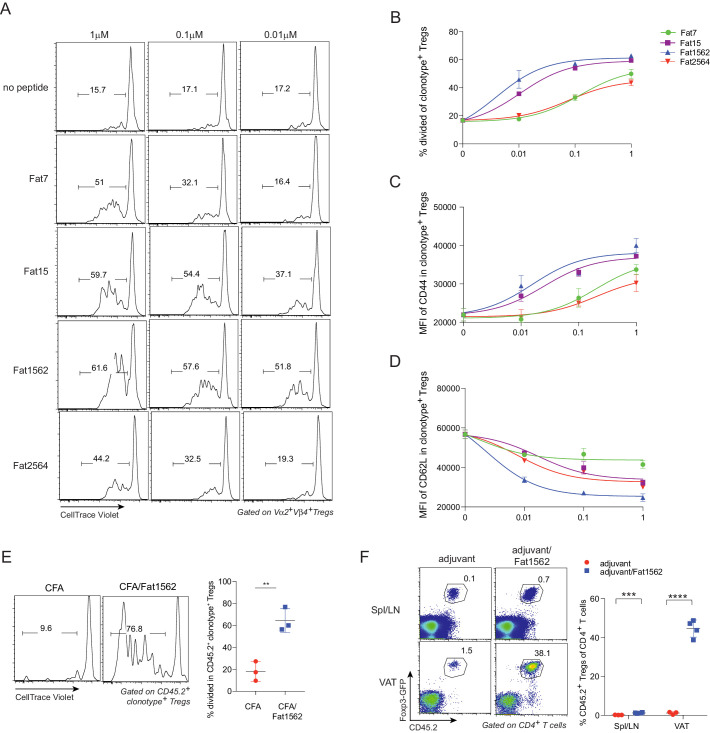
Figure 4. SPs induce proliferation and activation of vTreg53 Treg cells in vitro and in vivo.
(A–D) Proliferation and activation of vTreg53 Treg cells by different concentrations of SPs for 3 days in vitro (n = 3). (A) Representative flow cytometric plot of cell division. (B) Summary of cell proliferation. (C) Mean flourescence intensity (MFI) of CD44 staining in clonotype+ Treg cells. (D) MFI of CD62L staining in clonotype+ Treg cells. (E) Proliferation of transferred CD45.2+ vTreg53 Treg cells in the spleen of CD45.1+ B6 recipient mice immunized s.c. with CFA or CFA/Fat1562 at day 3 (n = 3). (F) Expansion of transferred CD45.2+ vTreg53 Treg cells in the Spl/LNs or VAT of CD45.1+ B6 recipient mice that were primed with CFA/fat1562 s.c. and boosted with IFA/Fat1562 i.p. (n ≥ 3). Data are mean ± SD. Data shown are representative of at least two independent experiments.


