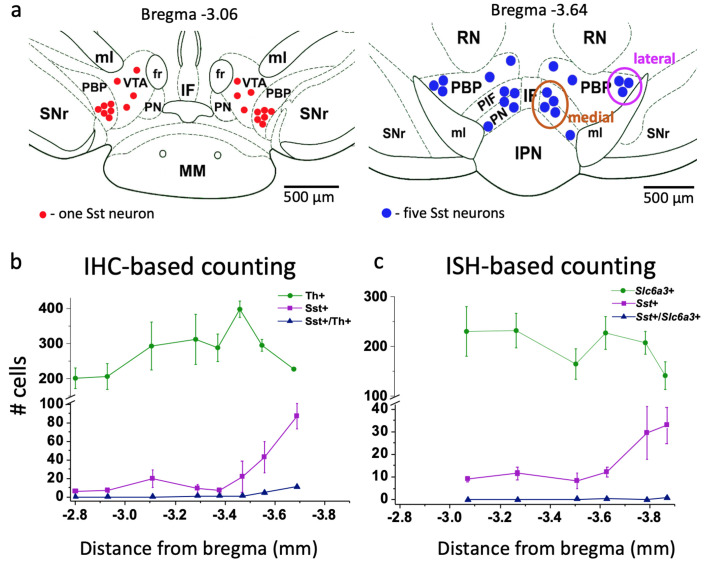
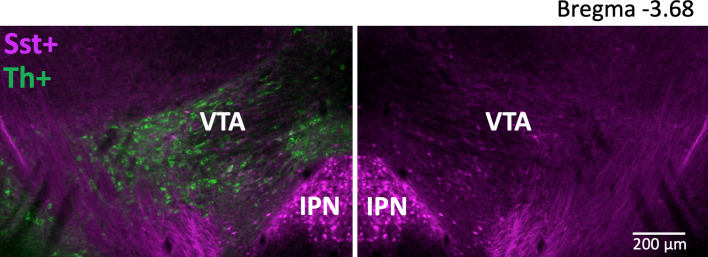
Figure 1. Localization and number of Sst and DA neurons in the mouse VTA.
(a) Schematic representation of lateral and medial Sst neuron clusters in coronal sections at different distances from bregma: the left figure represents the rostral VTA with only lateral clusters and small number of cells (each red dot = one Sst neuron); the right figure of the caudal VTA shows medial (PIF+PN) and lateral (PBP) cell clusters and a higher number of cells (each blue dot = 5 Sst cells). IF, interfascicular nucleus; IPN, interpeduncular nucleus; MM, medial mamillary nucleus; PBP, parabrachial pigmented nucleus; PIF, parainterfascicular nucleus; PN, paranigral nucleus; RN, red nucleus; SNr, substantia pars reticulata; VTA, ventral tegmental area (rostral part); ml, medial lemniscus; fr, fasciculus retroflexus. (b) Cell counts for DA and Sst cells using immunohistochemical (IHC) approach: Th-antibody staining for DA neurons combined with inbuilt dTomato signal for Sst neurons of Sst-tdTomato mice. Number of cells is given per 40-µm-thick coronal section as mean ± SEM (n = 3 mice) at different levels from bregma along the rostro-caudal axis. (c) Cell counts, using in situ hybridization (ISH) approach with RNAscope probes for Sst and Slc6a3 mRNAs. Number of cells is given per 12-µm-thick coronal section as mean ± SEM (n = 4 mice). The number of Sst neurons (magenta) increased in more caudal part of the VTA with both staining methods. Supporting data can be found in the Additional files: Figure 1—source data 1. Figure 1—figure supplement 1.


