. 2020 Aug 4;9:e59328. doi: 10.7554/eLife.59328

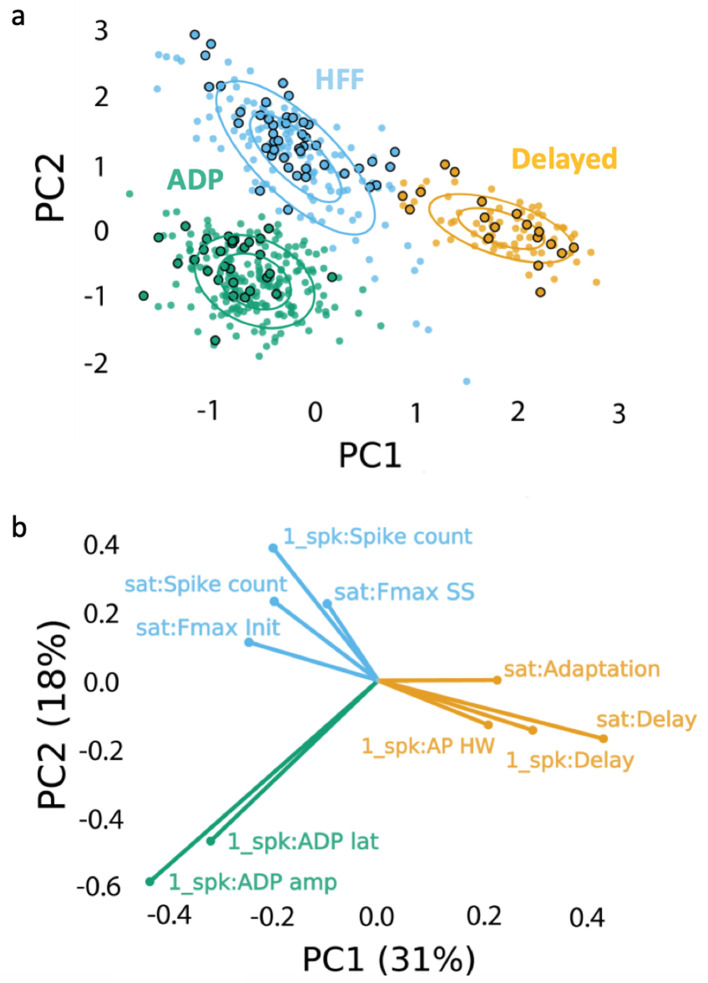
Figure 3. Clustering approach for electrophysiological subtyping of the Sst-expressing neurons.

Afterdepolarizing ‘ADP’ subtype is in green, high-frequency firing ‘HFF’ subtype in light blue, and ‘Delayed’ subtype in yellow. (a) Scatter plot of the Sst-neuron subtypes depicting the results of PCA (PC1 and PC2 as ‘x’ and ‘y’ axes, respectively) and GMM (big circles in corresponding colors). Non-outlined dots denote the cells from juvenile mice (n = 392), while black-outlined dots represent mature neurons from P60-P90 mice (n = 92): mature neurons reproduced the clustering pattern of younger neurons. (b) PCA weights of the electrophysiological characteristics that most influenced the clustering (see also Table 1). Clustering script and intermediate electrophysiological data to reproduce the results can be downloaded from here: https://version.aalto.fi/gitlab/zubarei1/clustering-for-nagaeva-et.-al.-sst-vta. Supporting data can be found in the Additional files: Figure 3—figure supplements 14.

Figure 3.

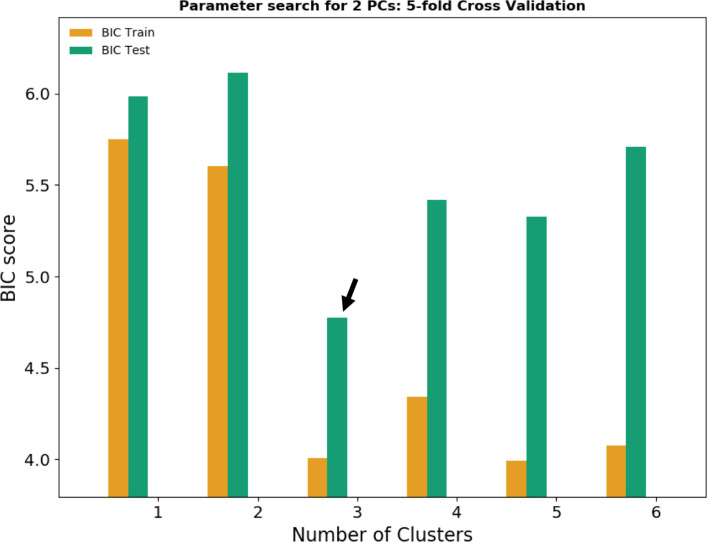
Figure 3—figure supplement 1. Bayesian information criterion (BIC) for model selection.

Figure 3—figure supplement 1.

According to the BIC, the combination of two principal components (PCs) and three clusters gives the best fit to describe the data (black arrow). Orange bars represent the BIC score for the model training dataset; green bars represent the BIC score for the test dataset unfamiliar to the model.
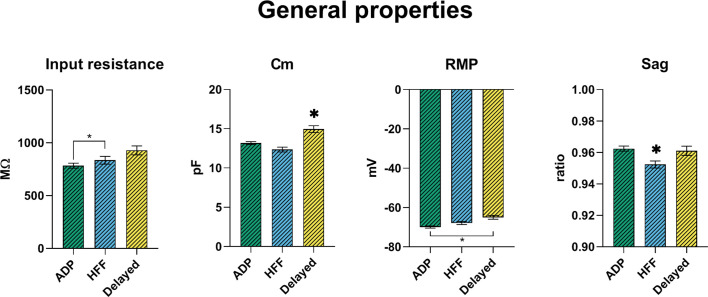
Figure 3—figure supplement 2. Passive membrane properties of VTA Sst-neuron subtypes.

Figure 3—figure supplement 2.

Cm, cell capacitance; RMP, resting membrane potential. All graphs show means ± SEM for ADP (n = 215), HFF (n = 92) and Delayed (n = 85) neurons. Statistical significances between groups were measured by one-way ANOVA with Tukey’s post hoc test. Big asterisks show values, which are significantly different from two others (p<0.05). Small asterisks with the connecting line indicate only two significantly different values.
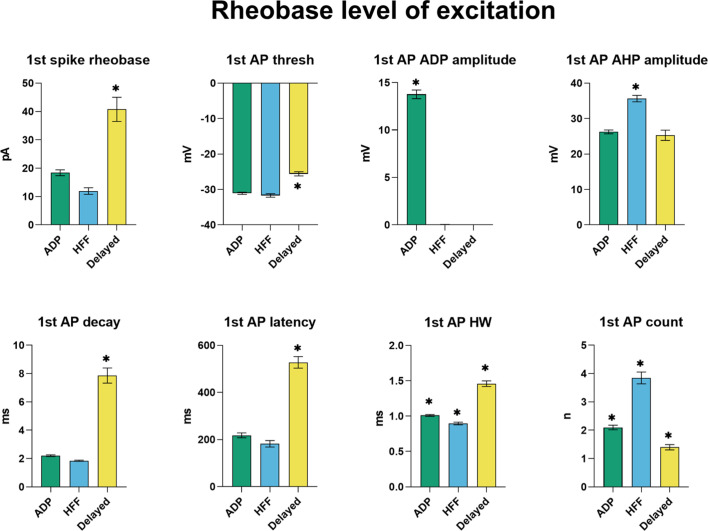
Figure 3—figure supplement 3. Electrophysiological properties of the first action potential (AP) at rheobase level of excitation.

Figure 3—figure supplement 3.

ADP, afterdepolarization; AHP; afterhyperpolarization; HW, half-width. All graphs show means ± SEM for ADP (n = 215), HFF (n = 92) and Delayed (n = 85) neurons. Statistical significances between groups were measured by one-way ANOVA with Tukey’s post hoc test. Big asterisks show values, which are significantly different from two others (p<0.05). Small asterisks with the connecting line indicate only two significantly different values.
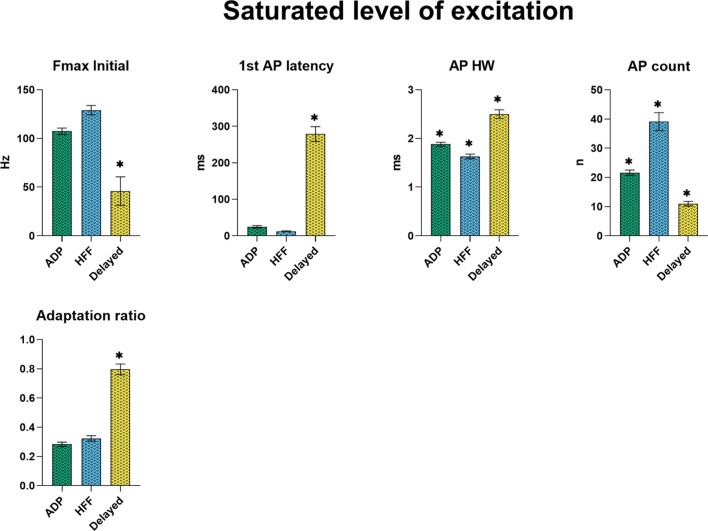
Figure 3—figure supplement 4. Electrophysiological properties of the subtypes at the saturating level of excitation, producing the highest number of action potentials.

Figure 3—figure supplement 4.

All graphs show means ± SEM for ADP (n = 215), HFF (n = 92) and Delayed (n = 85) neurons. Statistical significances between groups were measured by one-way ANOVA with Tukey’s post hoc test. Big asterisks show values, which are significantly different from two others (p<0.05). Small asterisks with the connecting line indicate only two significantly different values.