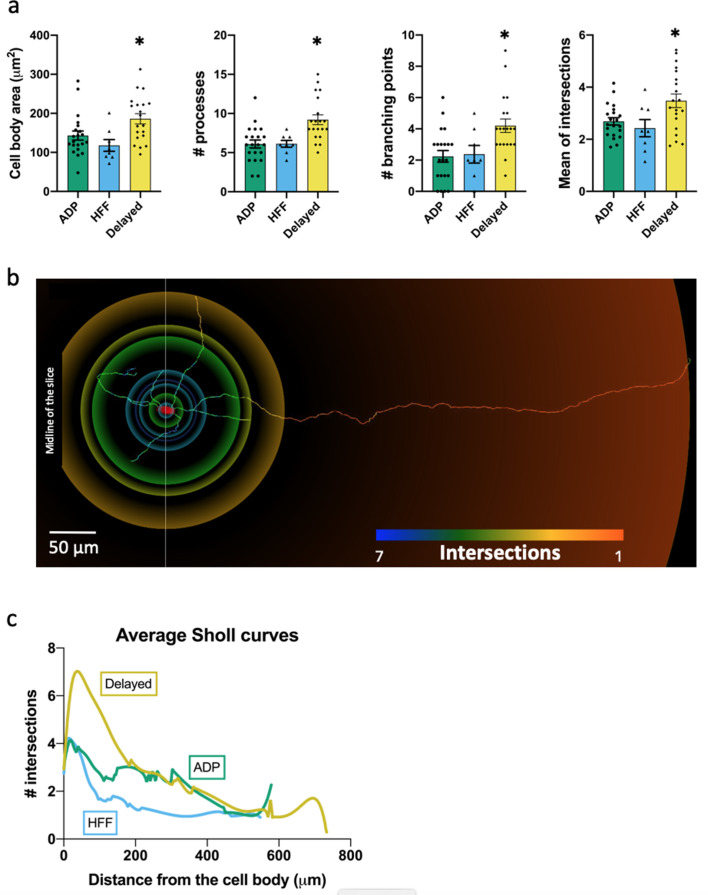
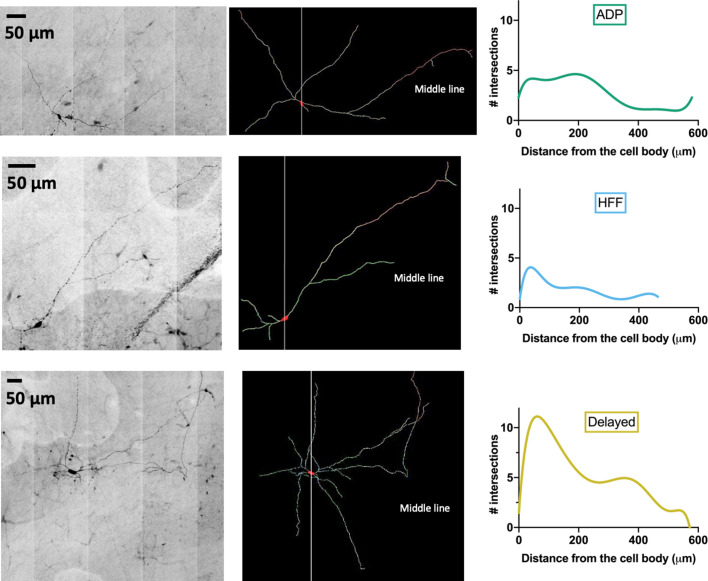
Figure 5. Morphological properties of the Sst-expressing neuron subtypes.
(a) Significantly different morphological characteristics between the three electrophysiological subtypes. Mean intersections, a parameter from Sholl analysis, shows how many times a circle of one radius intersects neuronal processes. All graphs show means ± SEM for ADP neurons (n = 21), HFF neurons (n = 8) and Delayed neurons (n = 20). Asterisks indicate values statistically different from two others (cell body area: F(2, 46)=5.565, p=0.0068; # processes: F(2, 46)=9.745, p=0.0003; # branching points: F(2, 46)=6.974, p=0.0023; mean intersections: F(2, 46)=5.280, p=0.0086). (b) Example of a Delayed neuron morphology with color-coded circles, produced by Sholl analysis: from red to blue for minimum to maximum number of intersections, respectively. White line crossing the cell body corresponds to the direction of the sagittal plane and ‘midline’ indicates center of the slice close to the interpeduncular nuclei (IPN, see also Figure 4a). (c) Average Sholl curves for the electrophysiological subtypes, showing that Delayed neurons had the largest number of intersections within 100 µm from the cell body. Morphology of the traced neurons and individual Sholl curves can be found in Additional files: Figure 5—source datas 1–2. Figure 5—figure supplements 1–2.


