. 2020 Aug 4;9:e59555. doi: 10.7554/eLife.59555

Figure 1. Structure of chicken CLC-7.

(A–B) Cryo-EM density map (A) and structure (B) of ggCLC-7 viewed from within the membrane (left), the cytoplasm (middle) and the lysosomal lumen (right) colored by domain with N-terminal domain in magenta, transmembrane domain in blue, CBS1 in cyan and CBS2 in green. Modeled non-protein densities are colored orange and unmodeled non-protein densities are colored grey in A. (C) Domain topology of ggCLC-7 colored by domain as in A. (D) Dimer interface with interacting residues colored in wheat.

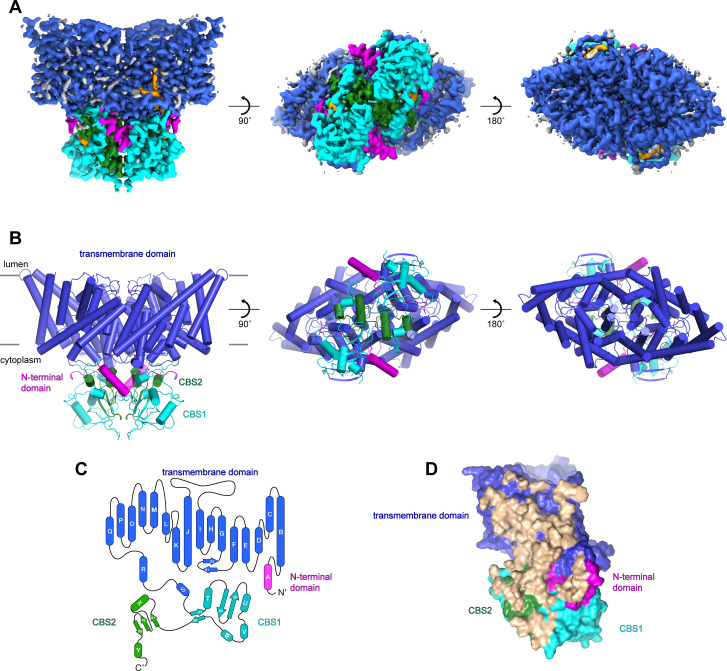
Figure 1.

Figure 1—figure supplement 1. Cryo-EM analysis of human CLC-7.

Figure 1—figure supplement 1.

(A) Representative cryo-EM image of hsCLC-7. (B) Two-dimensional class averages.
Figure 1—figure supplement 2. Cryo-EM analysis of chicken CLC-7.

Figure 1—figure supplement 2.

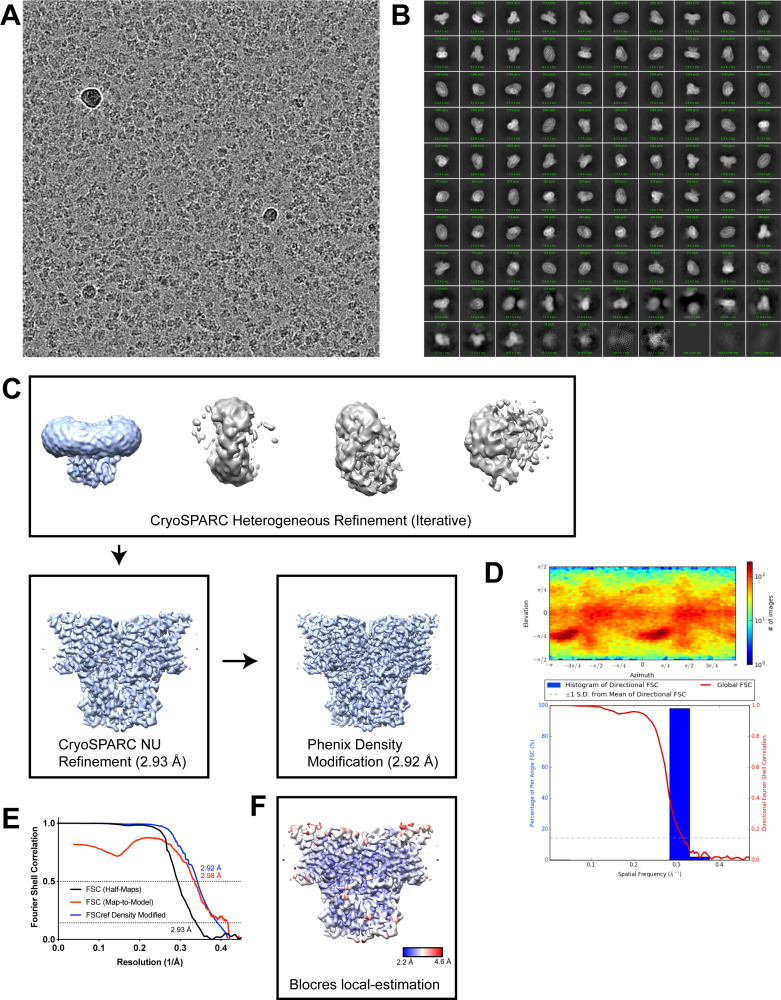
(A) Representative cryo-EM image of ggCLC-7. (B) Two-dimensional class averages. (C) Simplified image processing workflow. (D) Angular distribution and ThreeDFSC anisotropy plots. (E) Fourier shell correlation (FSC) of two unfiltered half-maps for ggCLC-7 (black), cross-correlation plot of two unfiltered half-maps following density modification (red) and FSC of map-to-model fit of ggCLC-7 with density modified map (blue). (F) ggCLC-7 density map colored by local resolution calculated with blocres (Heymann, 2018).
Figure 1—figure supplement 3. Representative cryo-EM density and model of chicken CLC-7.

Figure 1—figure supplement 3.

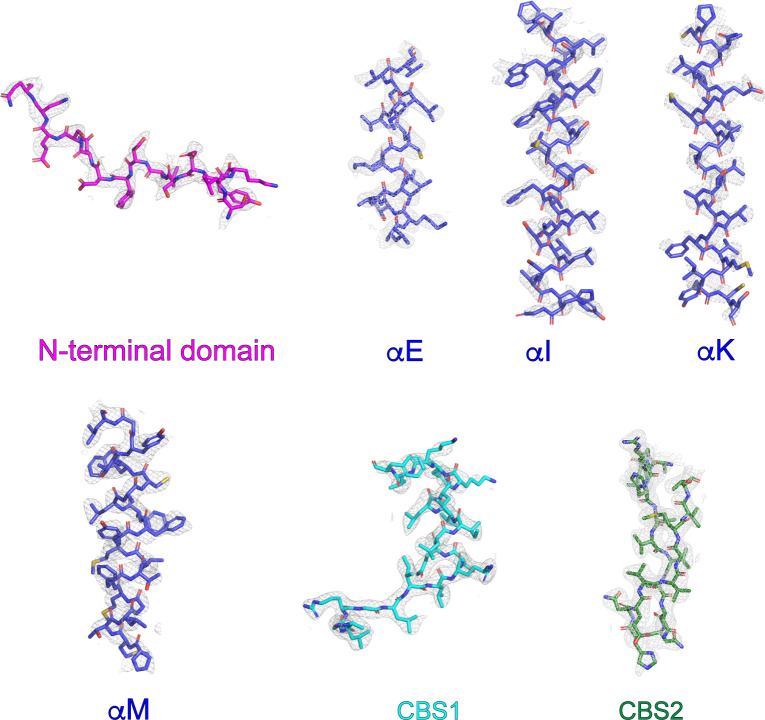
Representative sections of cryo-EM density shown as grey mesh displayed at 10 σ threshold. Refined coordinates are shown as sticks.