. 2020 Aug 4;9:e59555. doi: 10.7554/eLife.59555

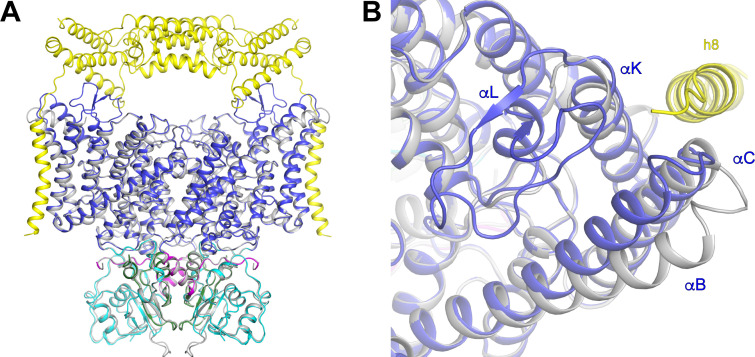
Figure 7. OSTM1-induced conformational changes.

(A) Structure of hsCLC-7/OSTM1 with CLC-7 colored by Cα displacement compared to ggCLC-7 and OSTM1 colored in grey. (B) hsCLC-7/OSTM1 transmembrane domain interface. Residues that participate in the interaction are shown as sticks. CLC-7 is colored in blue and OSTM1 is colored yellow. (C) Polar interaction network in the transmembrane domain interface between CLC-7 and OSTM1. (D) Loop between αK and αL is stabilized by interactions with OSTM1 luminal domain. (E) Cl--conduction pathways of human CLC-7/OSTM1 (colored by domain) and ggCLC-7 (grey). Interacting side chains are shown as sticks and Cl- ions are shown as spheres. Blue residue numbers correspond to human CLC-7 and grey numbers correspond to ggCLC-7.

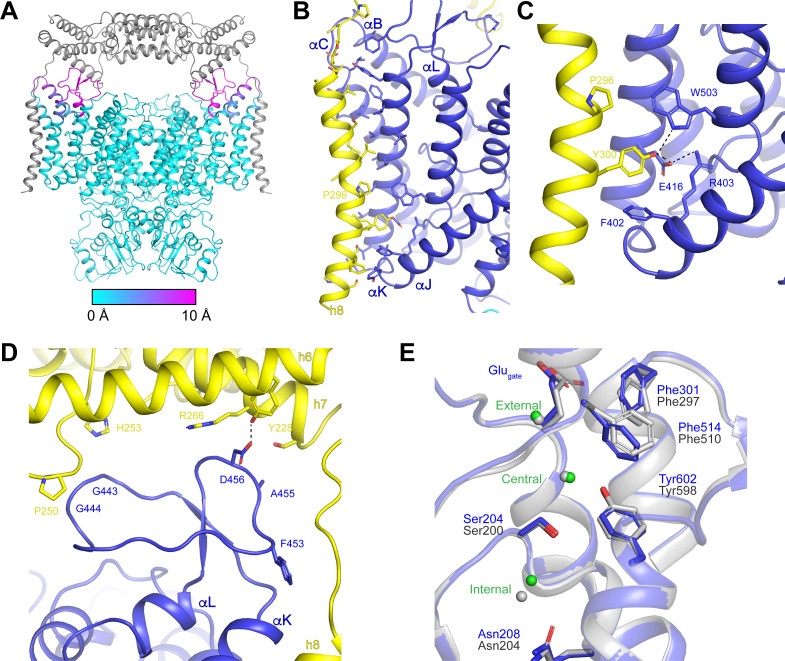
Figure 7.

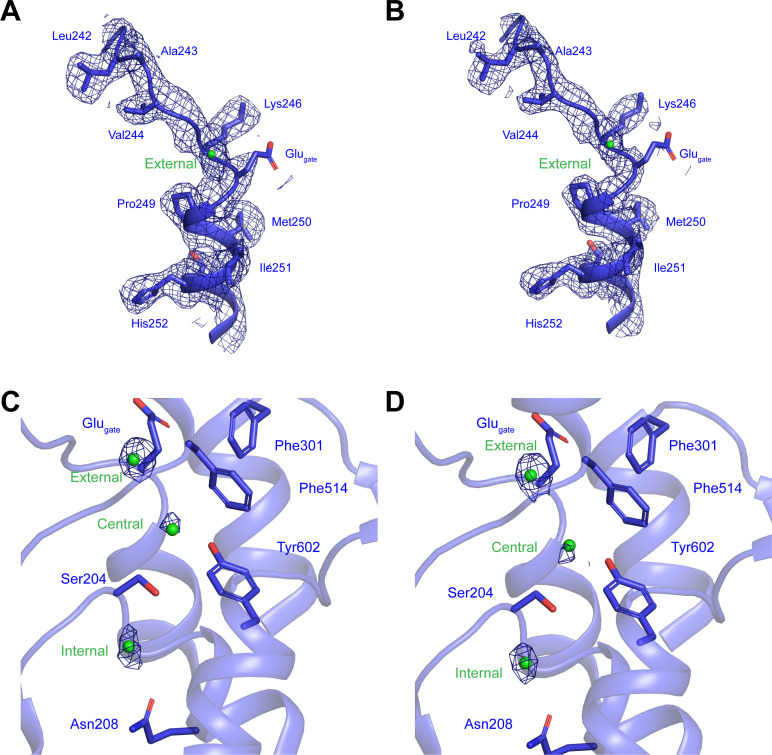
Figure 7—figure supplement 1. Structures of CLC-7 with and without OSTM1.

Figure 7—figure supplement 1.

(A) Superposition of hsCLC-7/OSTM1 (colored by domain) and ggCLC-7 (colored in grey) viewed from within the membrane. (B) Conformational changes in the CLC-7 transmembrane domain to accommodate OSTM1 binding viewed from the lysosomal lumen. HsCLC-7/OSTM1 is colored by domain and ggCLC-7 colored in grey.
Figure 7—figure supplement 2. Cl--conduction pathway in human CLC-7/OSTM1.

Figure 7—figure supplement 2.

(A–B) Experimental cryo-EM density for helix αF in hsCLC-7/OSTM1 consensus (A) and transmembrane domain focus refined (B) maps is shown as blue mesh contoured at 7 σ threshold. (C–D) Density for Cl--binding sites in hsCLC-7/OSTM1 consensus (C) and transmembrane domain focus refined (D) maps is shown as blue mesh contoured at 7 σ threshold. Cl- ions are shown as green spheres.
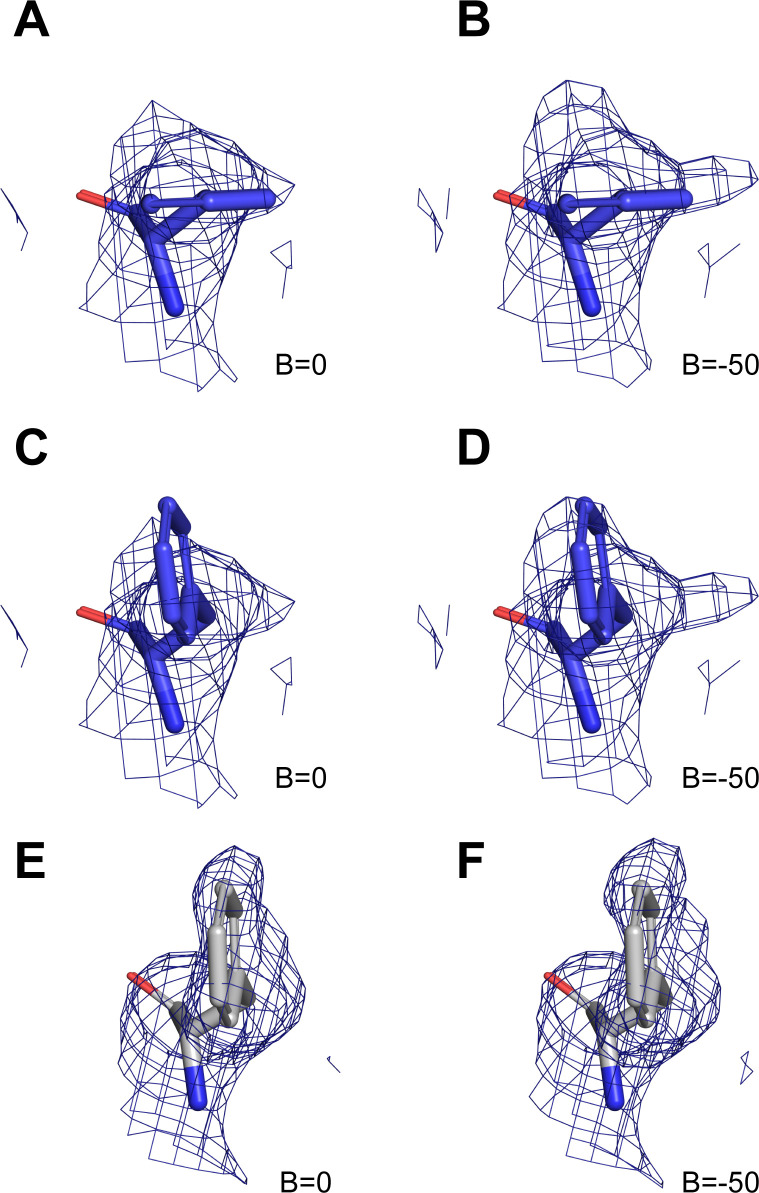
Figure 7—figure supplement 3. Heterogeneity in the conformation of Phe514/Phe510.

Figure 7—figure supplement 3.

(A–B) Cryo-EM density for Phe514 in conformation one in hsCLC-7/OSTM1 composite map (A) and sharpened (B=-50) composite map (B). (C–D) Cryo-EM density for Phe514 modeled in conformation two in hsCLC-7/OSTM1 composite map (C) and sharpened (B=-50) composite map (D). Density maps are shown as blue mesh contoured at 7 σ threshold. (E–F) Cryo-EM density for Phe510 modeled in conformation two in ggCLC-7 map (E) and sharpened (B=-50) map (F). Density maps are shown as blue mesh contoured at 8 σ threshold.
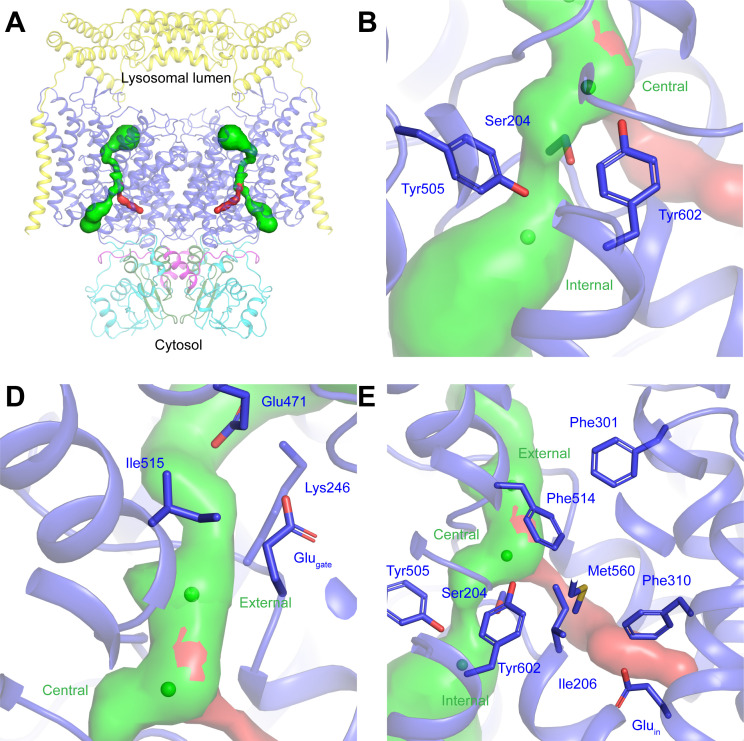
Figure 7—figure supplement 4. Ion conduction pathways in human CLC-7/OSTM1.

Figure 7—figure supplement 4.

(A) Cl-- and potential H+-conduction pathways through human CLC-7/OSTM1 shown as green and red surfaces, respectively. (B) The cytosolic constriction between the central and internal Cl--binding sites is formed by Ser204, Tyr505 and Tyr602 narrows the pathway to a minimum radius of 0.4 Å. (C) The luminal constrictions are formed by Glugate, Lys246 and Ile515 and by Lys246, Glu471 and Ile515 and narrow the pathway to a minimum radius of 1.0 Å. (D) Potential H+ conduction pathway between the central Cl- site and Gluin. The pathway is sealed from the Cl- pathway by Phe514 and Tyr602 and from the cytosol by Phe310 and Met560.