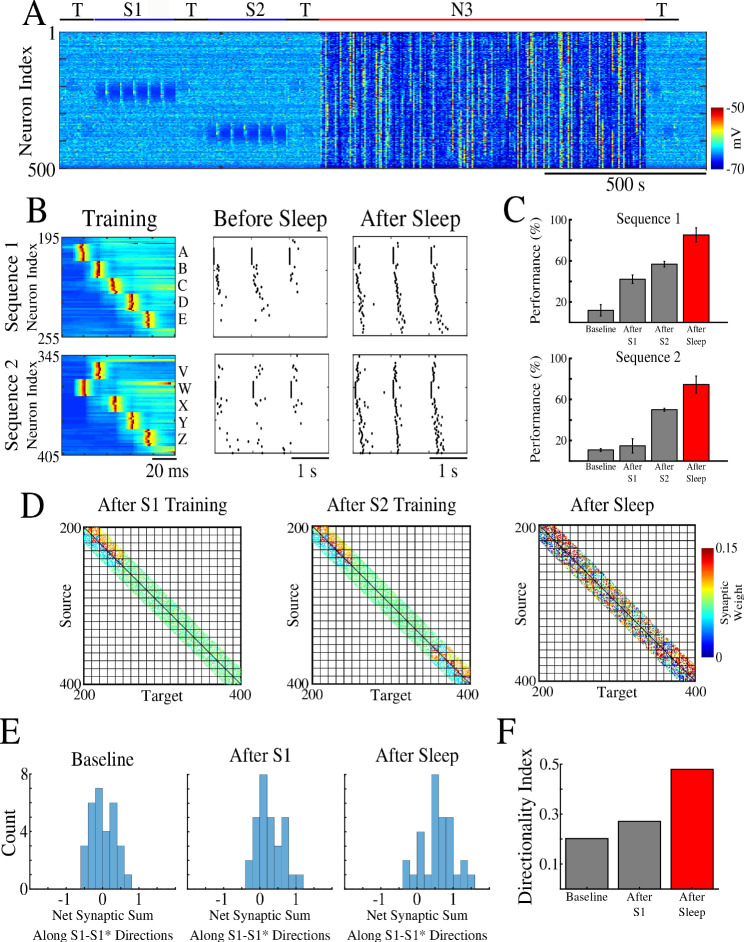
Figure 2. Two spatially separated memory sequences show no interference during training and both are strengthened by subsequent sleep.
(A) Network activity during periods of testing (T), training of two spatially separated memory sequences (S1/S2), and sleep (N3). Cortical PY neurons are shown. Color indicates voltage of neurons at a given time. (B) Left panels show an example of training sequence 1 (S1, top) and sequence 2 (S2, bottom). Middle panels show examples of testing both sequences prior to sleep. Right panels show examples of testing after sleep. Note, after sleep, both sequences show better completion. (C) Performance of S1 and S2 completion before any training (baseline), after S1 training, after S2 training, and after sleep (red). (D) Synaptic weight matrices show changes of synaptic weights in the regions trained for S1 and S2. Left panel shows weights after training S1; middle panel shows weights after training S2; right panel shows weights after sleep. Color indicates strength of AMPA synaptic connections. (E) Distributions of the net sum of synaptic weights each neuron receives from all the neurons belonging to its left neighboring group (S1 direction) vs its right neighboring group (opposite direction, defined as S1* direction below) within a trained region at baseline (left), after S1 training (middle) and after sleep (right). (F) Synaptic weight-based directionality index before/after training (gray bars) and after sleep (red bar).


