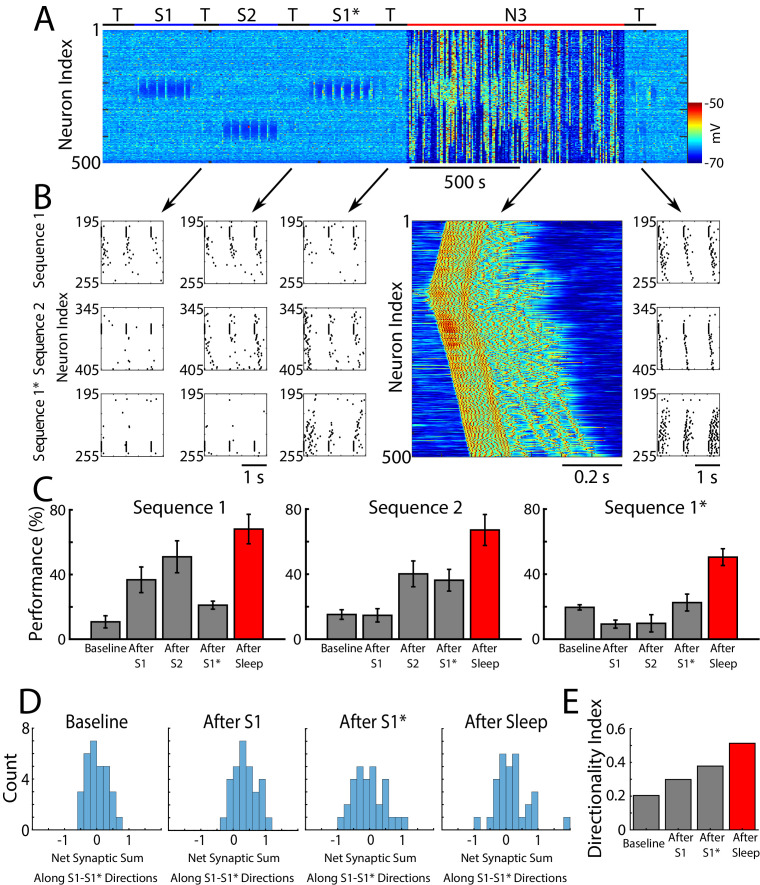
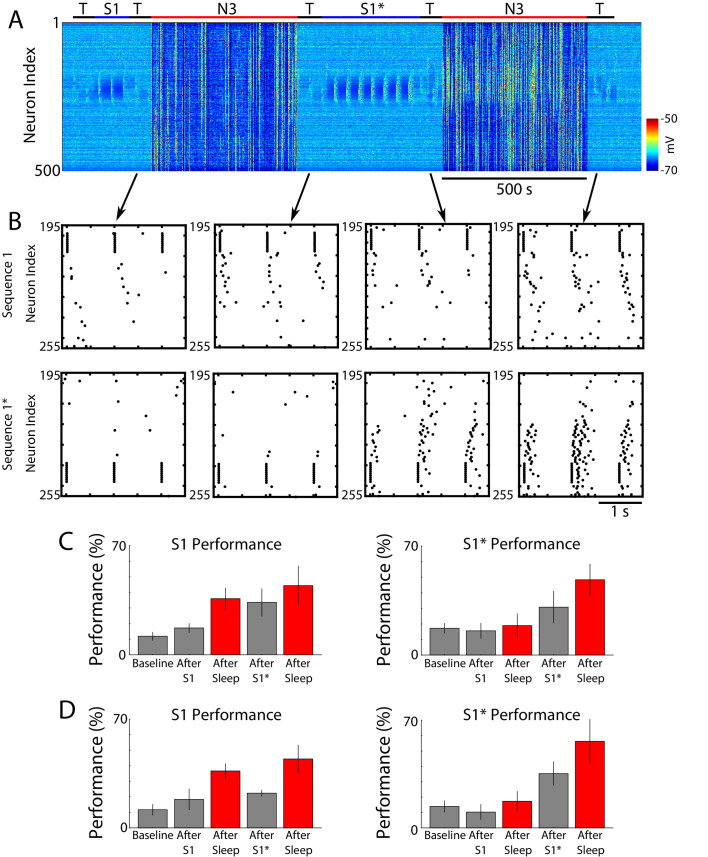
Figure 5. Sleep prevents the old memory sequence from forgetting and improves performance for all memories.
(A) Network activity (PY neurons) during sequential training of sequencies S1/S2/S1* (blue bars) followed by N3 sleep (red bar). No stimulation was applied during sleep. (B) Examples of testing for each trained memory at different times. The top row corresponds to the testing of S1, middle is testing of S2, and bottom is testing of S1*. Heatmap shows characteristic cortical Up state during SWS. (C) Testing of S1, S2, and S1* shows damage to S1 after training S1*, and increase in performance for all three sequences after sleep (red bars). (D) Distributions of the net sum of synaptic weights each neuron receives from all the neurons belonging to its left vs right neighboring groups within a trained region at baseline (left), after training S1 (middle/left), after training S1* (middle/right), and after sleep (right). Wider distribution indicates presence of neurons that are strongly biased to one sequence or the other. (E) Synaptic weight-based directionality index before/after training (gray bars) and after sleep (red bar).


