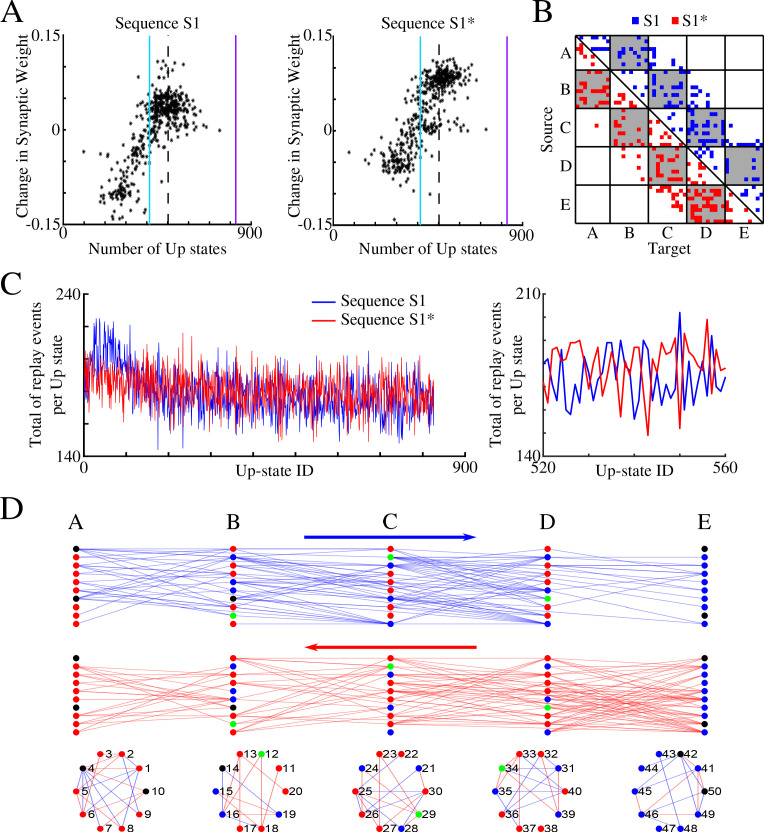
Figure 6. Sleep promotes replay of both overlapping memory sequences during each Up state.
(A) Change in synaptic weight over entire sleep period as a function of the number of Up states where a given synapse was preferentially replayed. Each star represents a synapse in the direction of S1 (left) or S1* (right). Dashed line indicates the threshold (66% of Up states) used to identify synapses that are replayed reliably for analysis in (B); purple line indicates the maximum number of Up states; blue line demarcates the 50% mark of the total number of Up states. (B) Thresholded connectivity matrix indicating synaptic connections showing reliable replays for S1 (blue) or S1* (red). Grey boxes highlight between group connections. (C) Number of replay events for inter-group synapses per Up state across all Up states (left) and a subset of Up states (right) for S1 (blue) and S1* (red). Note that both sequences show similar high number of replays across all Up states, suggesting that both sequences are replayed during each Up state. (D) Network's graphs showing between group (top/middle) and within group (bottom) connections after sleep. Edges shown here are those which revealed reliable replays of S1 (blue) and S1* (red) as shown in B (right). Nodes are colored blue (red) if more than 50% of their incoming connections show reliable replay in direction of S1 (S1*). Green nodes indicate neurons with high in-degrees, receiving the same number of ‘replayed’ synapses from left and right, and black indicates that none of these conditions are met.

