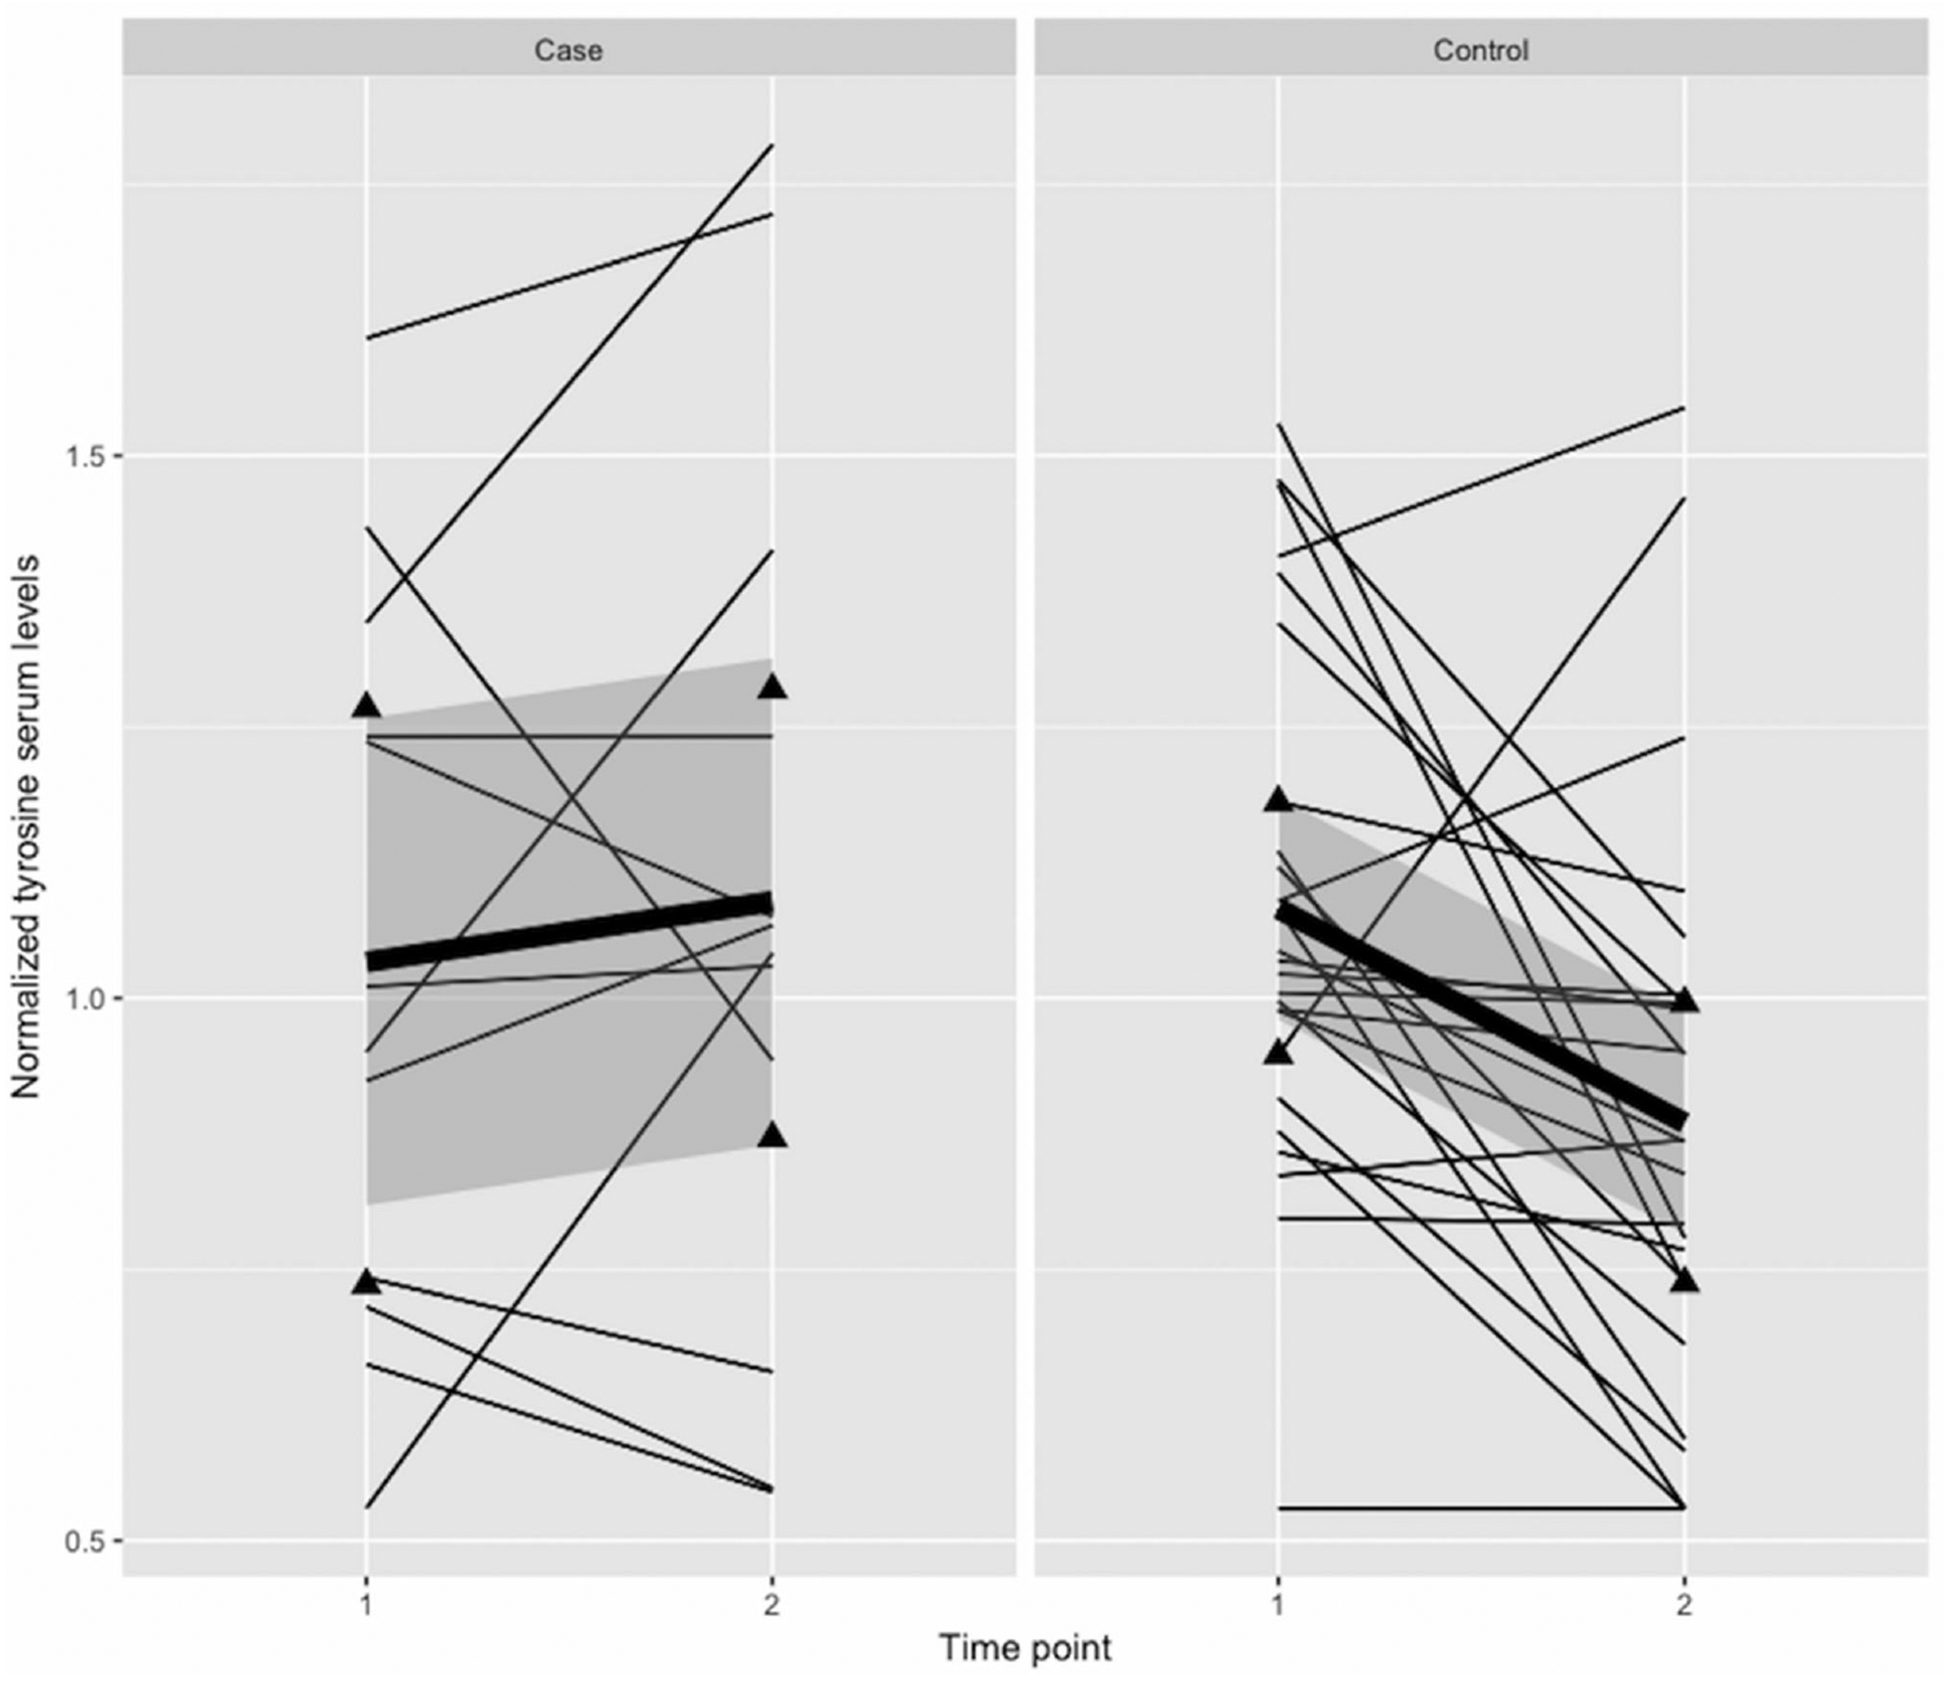
FIGURE 2.

Trajectories of normalized tyrosine serum levels for all individual cases with premenstrual dysphoric disorder (PMDD) and controls. Time point 1, gonadal suppression; Time point 2, 4 weeks progesterone add-back. Average trends are represented by the bold regression line, triangles represent lower and upper quartiles and shadings standard errors
