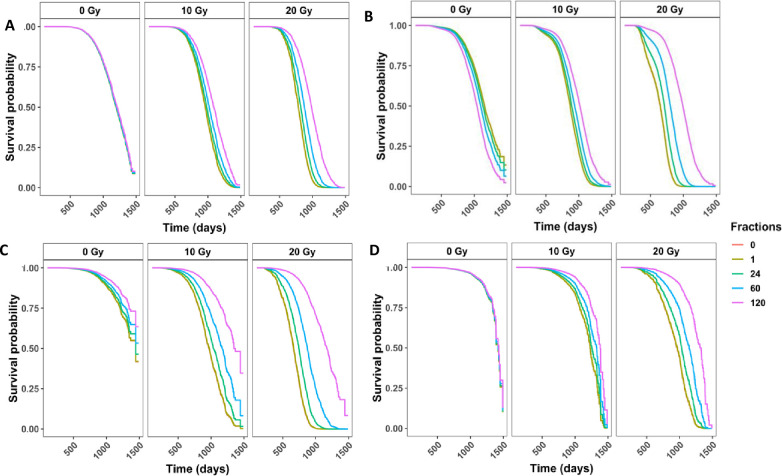
Fig 3. Competing risks models for specific causes of death in gamma irradiated mice with age as a time scale and sex, age first irradiated, total dose, fractions, and the interaction between total dose and fractions as independent variables.
Survival curves for cause of death being (A) any solid tumors, (B) lymphomas, (C) non-tumors, and (D) cause of death unknown. Model estimates, confidence intervals and p-values are listed in the corresponding Table 2. All four models have a significant interaction term between total dose and the number of fractions (tumor p = 0.001, lymphoma p<0.001, non-tumor p <0.001, CDU p <0.001). The graphs represent predicted outcomes for female mice first irradiated at 120 days.

