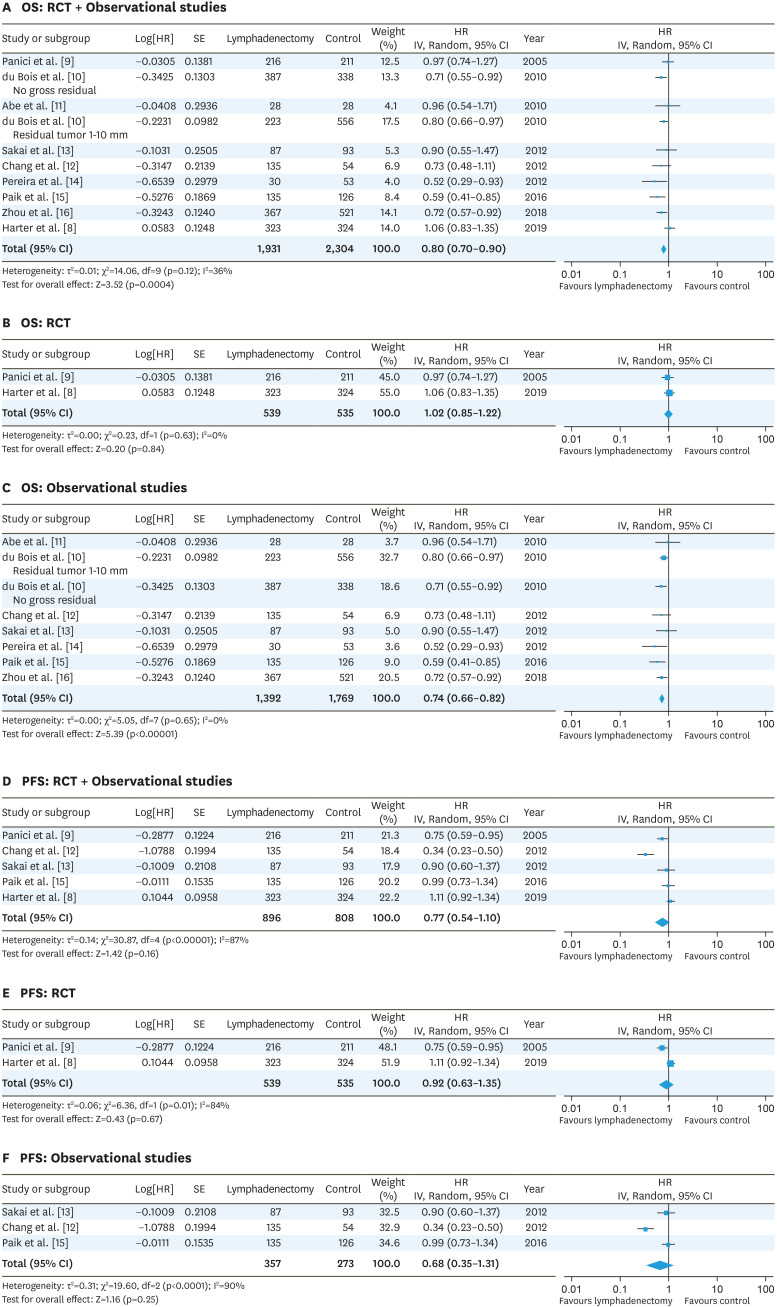
Fig. 3. Forest plots for the lymphadenectomy vs. control studies of the OS (A-C) and PFS (D-F) in advanced-stage ovarian cancer. The test for heterogeneity is indicated with the I2 value.
CI, confidence interval; HR, hazard ratio; OS, overall survival; PFS, progression-free survival; RCT, randomized controlled trial; SE, standard error.

