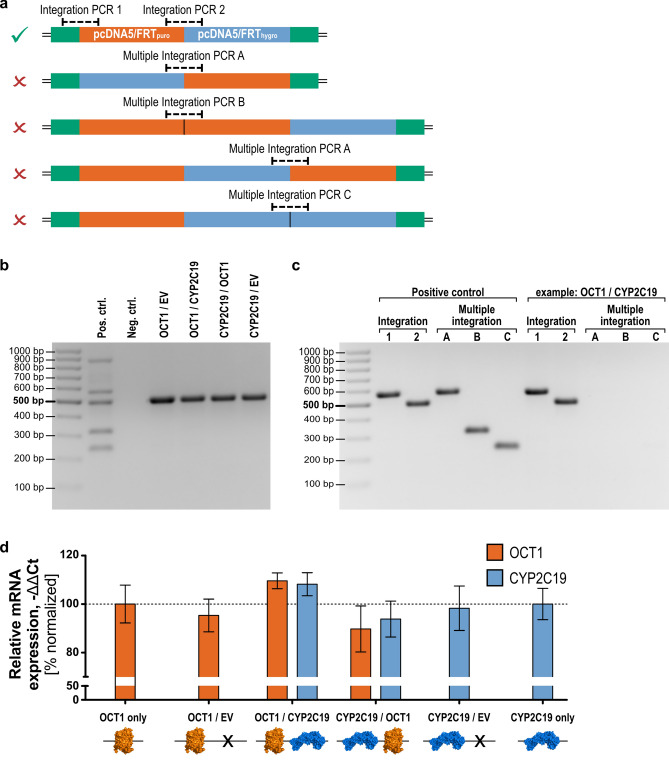
Figure 4.
Validation of the double-Flp-In cell clones on genomic and transcriptional level. (a) Simultaneous integration of two vectors my lead to at least four unwanted combinations (red ‘x’) besides the intended one (green tick). (b) Screening of cell clones by multiplex PCR allowed verification of single integration of each vector (EV empty vector; primers as given in Table 1). (c) More precise single PCRs were used to validate correct integration for each cell clone, as shown here using one representative example. (d) OCT1 and CYP2C19 gene expression analysis of double-Flp-In cell clones compared to single transfected cell lines. Results of n = 3 independent experiments are shown. Gene expression was normalized to the OCT1 only or CYP2C19 only transfected cell lines, respectively. Figure (d) was created using GraphPad Prism version 5.01 for Windows, GraphPad Software, La Jolla, California, USA, www.graphpad.com. Protein icons of OCT1 and CYP2C19 were created using The PyMOL Molecular Graphics System, Version 1.3, Schrödinger, LLC, www.pymol.org.

