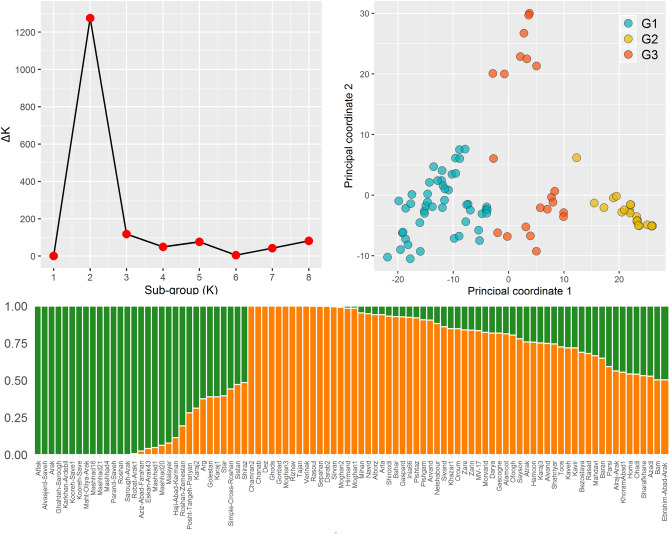
Figure 1.
The structure plot of the 92 Iranian wheat cultivars and landraces identified by K = 2 using 6,349 SNPs. (a) Plot of the ad hoc statistic ΔK, which is ΔK tends to peak at the K value that corresponds to the highest hierarchical level of substructure. The modal value of this distribution is the true K, here two clusters. (b) Principal coordinate analysis (PCoA) plot of the first two PCo in 92 wheat genotypes including landrace (yellow), cultivar genotype (blue) and intermediate cultivar genotype (red). The first and second PCo respectively make up 19 and 6% of the total variation. (c) Population structure inference of the 92 Iranian wheat genotypes based on SNP marker, using STRUCTURE. Vertical bars display individual genotypes. The segment color length in each vertical bar depicts the proportion contributed by each of the two populations in the model to that individual.

