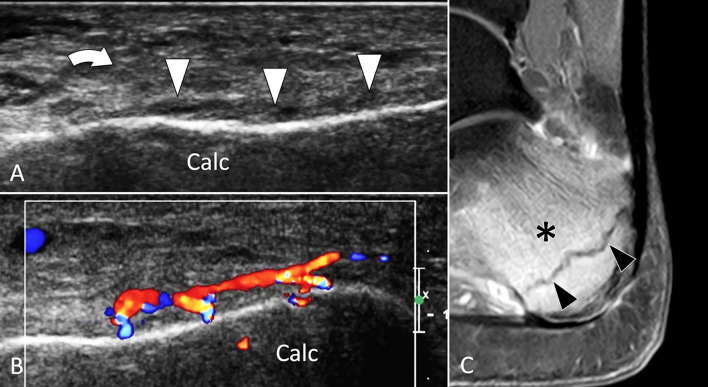
Fig. 32.
Stress fracture. Calcaneum. a, b Axial oblique conventional (a) and colour Doppler (b) sonograms. c Sagittal T2-weighted fat sat MR image. Sonograms show periosteal thickening (white arrowheads) of the calcaneum (Calc). Note local hyperaemia at colour Doppler and associated oedema (curved arrows) of the subcutaneous soft tissues. c MR illustrates bone marrow oedema (asterisk) and the stress fracture as a hypointense line (black arrowheads)

