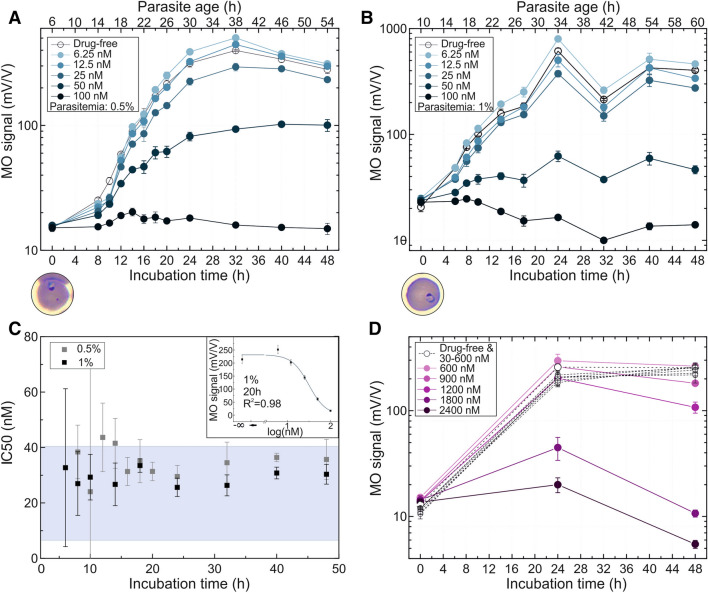
Figure 4.
Inhibitory effect of chloroquine on P. falciparum 3D7 and W2 cultures as measured by RMOD assay. A,B MO values of the P. falciparum 3D7 culture with 0.5% and 1% parasitemia incubated with various drug concentrations as a function of incubation time up to 48 h. The top axis shows the age of the parasites at the given sampling points, determined by optical microscopic evaluation. Below the graph, an image shows the typical parasite stage at the starting point of the assay. The color coding of the curves indicates the increasing drug concentrations from light to dark shades. The empty circles represent the drug-free control samples. Each circle represents the average of the MO values measured on triplicates. C IC50 values as a function of incubation time. IC50 values and the standard errors of their fit are represented by black squares in case of the 1% assay and grey squares in case of the 0.5% assay. The blue shaded area indicates the range of formerly reported IC50 values (Supplementary Table S1.)10,29–33,35,52–54. The upper right corner shows a representative dose–response fit curve corresponding to the 20 h time point of the 1% assay. D MO values of the resistant P. falciparum W2 culture with 1% parasitemia incubated with various drug concentrations as a function of incubation time up to 48 h. The color coding of the curves indicates the increasing drug concentrations from light to dark shades. The empty squares represent the growth of samples treated with an ineffective drug dose (30–600 nM). Each circle represents the average of triplicates.

