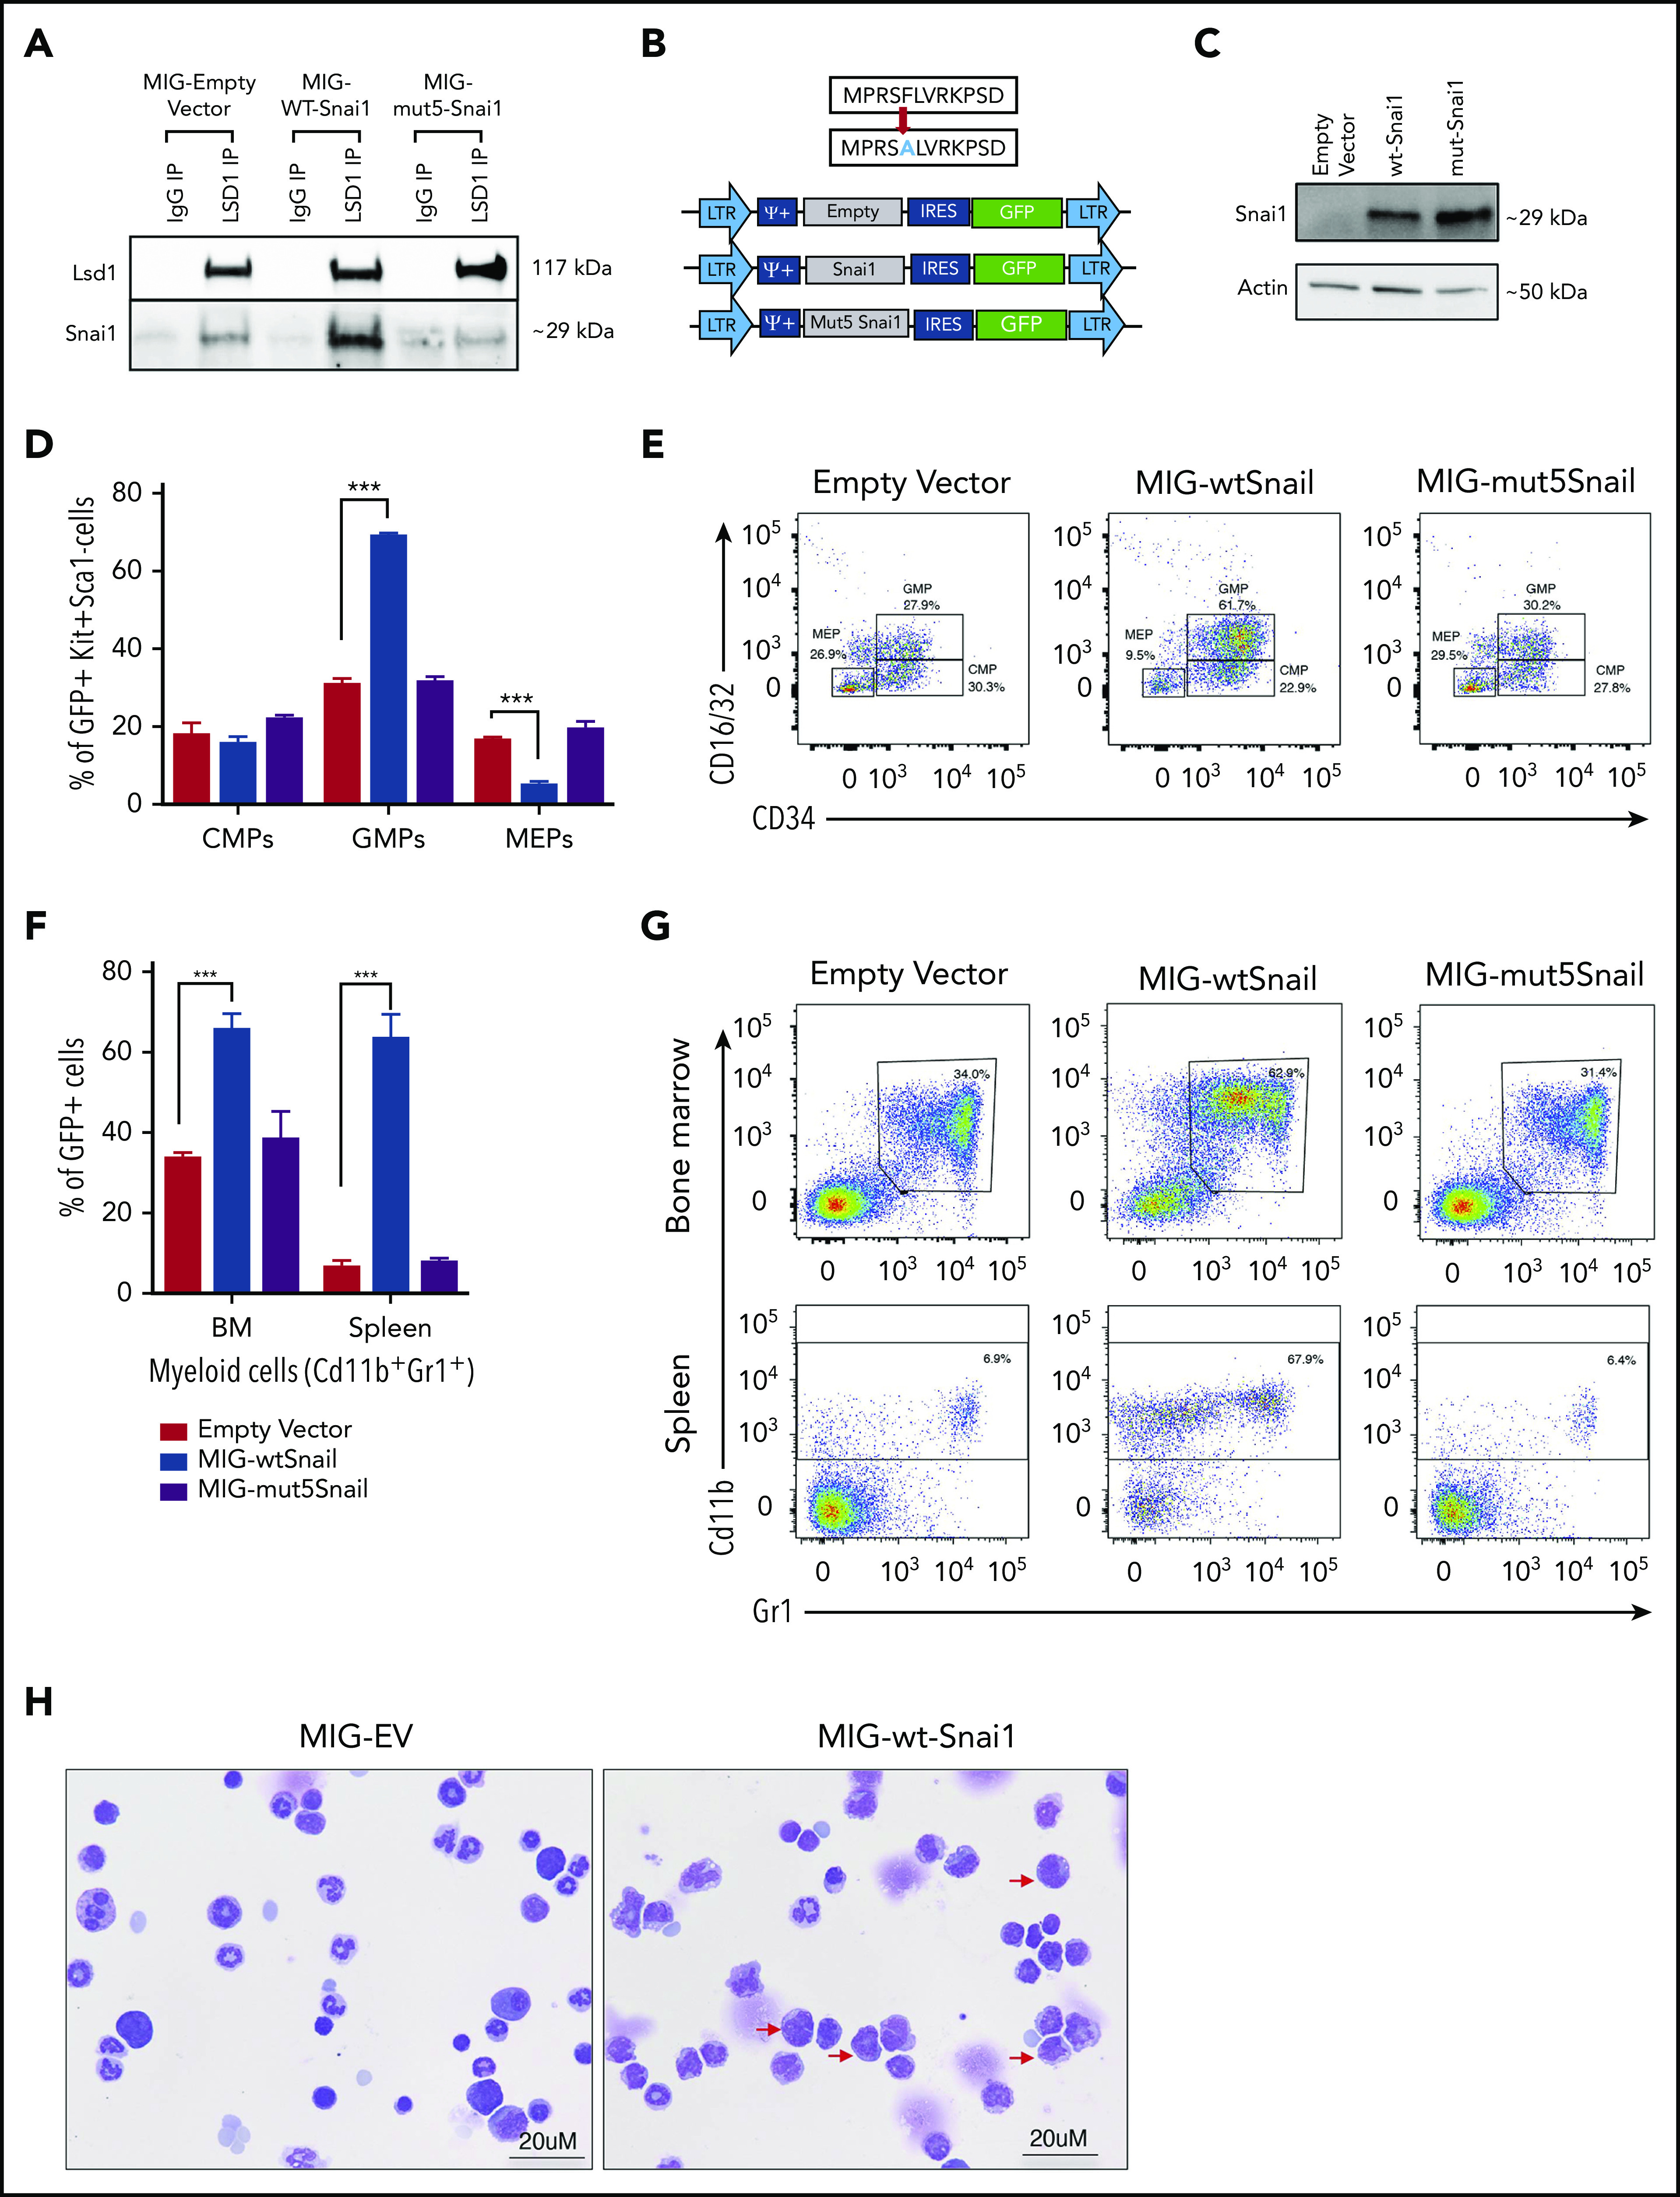
Figure 5.

SNAI1 requires interaction with LSD1 to induce myeloid development defects. (A) Western blot analysis showing that LSD1 immunoprecipitation is able to pull down SNAI1 in the mouse hematopoietic progenitor cell line (HPC7). Empty vector control (MIG-EV)–transduced cells and MIG-mut5Snai1–transduced cells show a low level of endogenous SNAI1 pulldown, whereas the MIG-Snai1–transduced cells show a much higher level of SNAI1 pulldown because of the overexpressed WT-SNAI1 protein also being pulled down. The overexpressed mut5SNAI1 protein is not able to be pulled down by LSD1. (B) Overview (upper panel) of the mutant version of Snai1 that was generated with a phenylalanine (F) to alanine (A) amino acid change at position 5 of the SNAI1 protein. WT Snai1 cDNA and the mutant Snai1 cDNA were individually cloned into the MSCV-IRES-GFP retroviral vector. An empty MSCV-IRES-GFP vector was used as a transduction control. (C) MIG-Snai1– and MIG-mut5-Snai1–transduced cells both show high levels of SNAI1 protein, whereas the endogenous SNAI1 protein is unable to be detected in the empty vector–transduced cells. The western blot also demonstrates that the F→A mutation in the mut5-SNAI1 protein does not affect its overall protein stability or antibody recognition. (D) Flow cytometric quantification of the GFP+ bone marrow cell population in MIG-Snai1–recipient mice at 12 weeks posttransplantation, showing a significantly increased proportion of granulocyte/macrophage progenitor cells (GMPs) and a significantly decreased proportion of megakaryocyte/erythroid progenitor cells (MEPs) compared with GFP+ cells in MIG-EV–recipient mice (blue bars compared with black bars). The common myeloid progenitor cell (CMP) population was not different between the 2 mouse cohorts (left panel). No difference was observed in MIG-mut5Snai1 bone marrow compared with MIG-EV control bone marrow (purple bars compared with black bars). (E) Representative myeloid progenitor flow cytometric plots from empty vector, MIG-Snai1, and MIG-mut5Snail mice. (F) A significant increase in the proportion of mature myeloid cells was also observed within the GFP+ cell population in MIG-Snai1–recipient mouse bone marrow and spleen (blue bars compared with black bars). These myeloid abnormalities were completely absent in the MIG-mut5Snai1–recipient mice (purple bars). Data are represented as mean + standard error of the mean (SEM); n = 3 biological replicates. (G) Representative myeloid cell flow cytometric plots from bone marrow and spleens of MIG-EV, MIG-Snai1, and MIG-mut5Snail mice. (H) Wright-Giemsa staining of GFP+ bone marrow cytocentrifuge preparations shows normal myeloid development in MIG-EV–recipient mice, whereas in MIG-Snai1–recipient mice, there is a significant increase in the number of immature myeloid cells (red arrows), and a significant reduction of mature granulocytes. (D-E) Data are presented as mean + SEM; n = 3 mice from each cohort ***P < .001 Student 2-sided unpaired t test.
