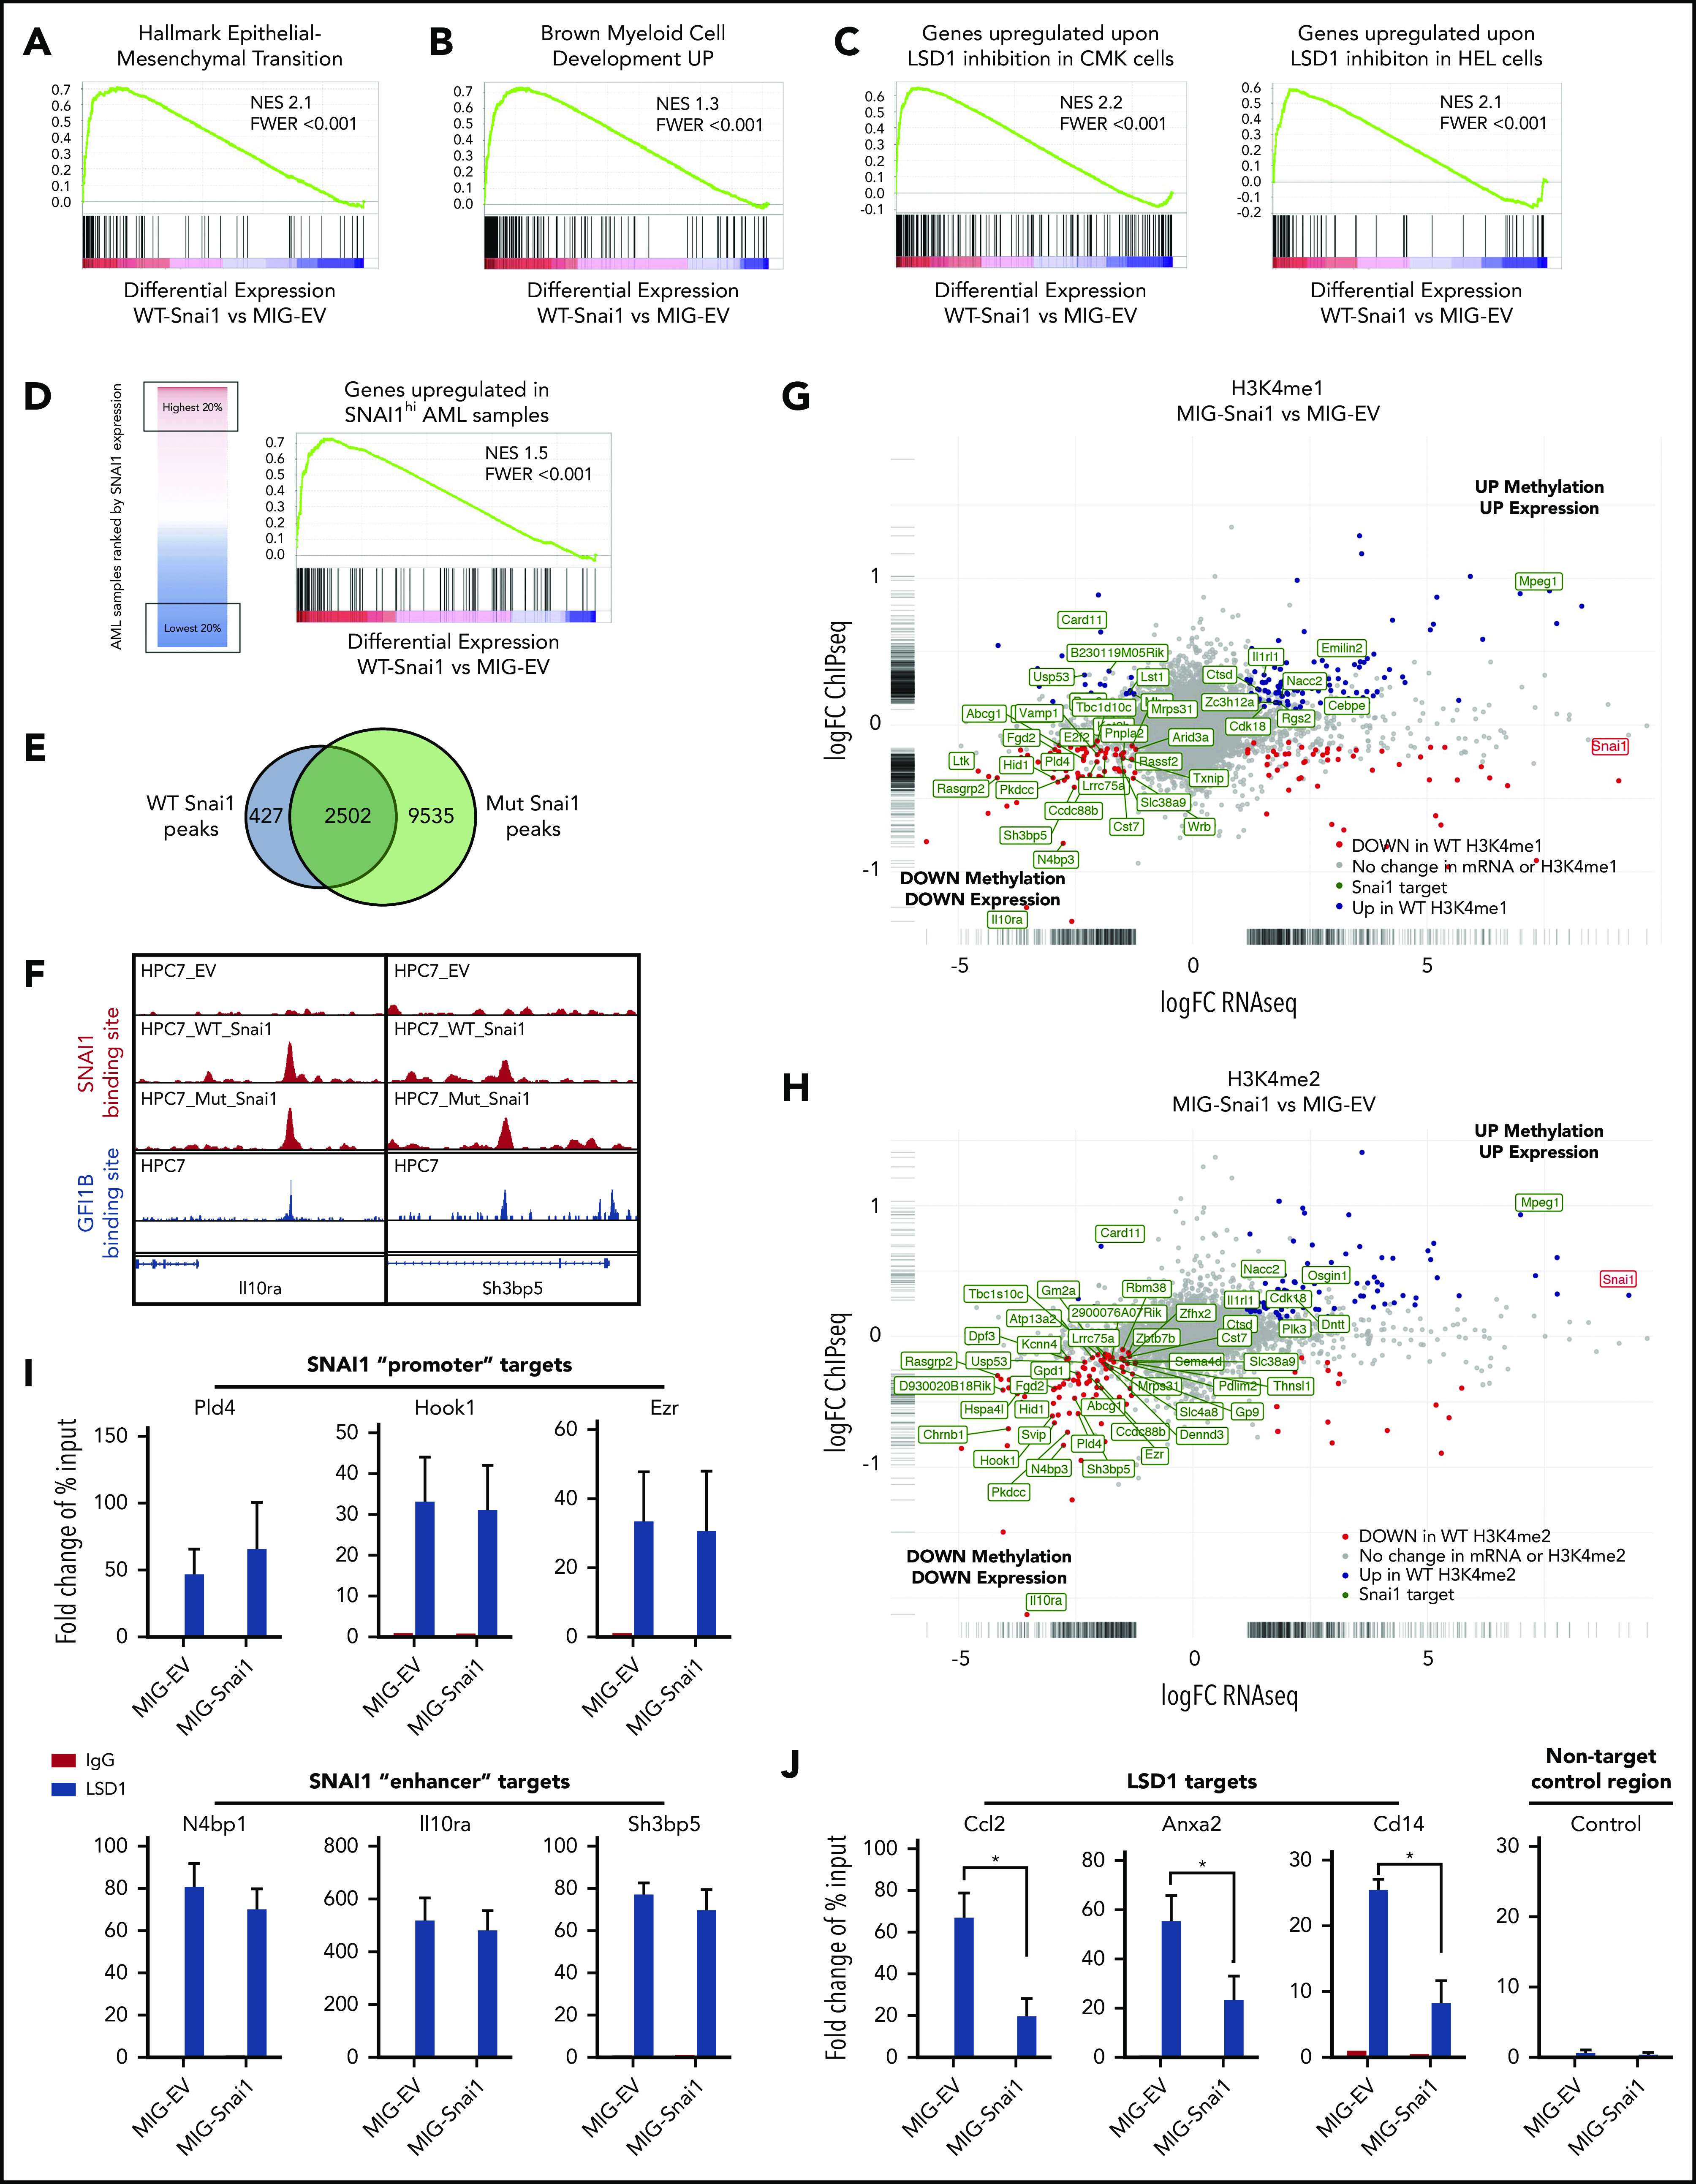
Figure 6.

Genomic analysis of HPC7 cells transduced with either MIG-Snai1, MIG-mut5Snai1, or MIG-EV. Gene set enrichment analysis (GSEA) on RNA-seq data from MIG-Snai1 vs MIG-EV identified a significant correlation between genes upregulated in HPC7 cells expressing Snai1 (MIG-Snai1) and genes involved in the EMT (GSEA: hallmark epithelial mesenchymal transition) (A), genes upregulated upon myeloid development (GSEA: brown myeloid cell development up), genes upregulated upon LSD1 inhibition in HEL and CMK leukemia cell lines (GSE68348) (C), and genes upregulated in SNAI1 high AML patient samples (GSE10358) (D). (E) Overlap between WT SNAI1 and mut5-SNAI1 binding sites in HPC7 cells indicates that mut5SNAI1 protein is still capable of binding DNA. (F) Sample IGV tracks showing clear overlap of WT SNAI1 and mut5SNAI1 binding sites in 2 representative gene regulatory elements for Il10ra and Sh3bp5, as well as with published binding sites for GFI1B.49 FC-FC plot showing differentially expressed genes on the x-axis and differential H3K4me1 (G) or H3K4me2 (H) methylation levels on the y-axis. A correlation between differential methylation and differential expression in MIG-Snai1 cells is evident in both plots. Genes in green have an identified SNAI1 binding site in the ChIP-seq data. Red and blue dots indicate genes with significantly reduced or significantly increased respectively gene expression and methylation in MIG-Snai1 cells using a P value cut off <.05. (I) LSD1 ChIP–quantitative PCR (qPCR) results for 6 SNAI1 target genes that have reduced gene expression and reduced H3K4 methylation in MIG-Snai1 HPC7 cells. ChIP-qPCR data show binding of LSD1 directly overlapping SNAI1 binding sites in both the MIG-EV and MIG-Snai1 cells at all sites analyzed. (J) LSD1 ChIP-qPCR results for 3 LSD1 target sites showing significantly reduced LSD1 binding upon SNAI1 expression in MIG-Snai1 HPC7 cells. Control immunoglobulin G (IgG) samples were used as a control for nonspecific ChIP enrichment, and a nontarget control region was used to show specific pulldown at LSD1-bound sites compared with other sites within the genome. Data analyzed using a Mann-Whitney 1-tailed t test. *P < .01.
