Figure 2.
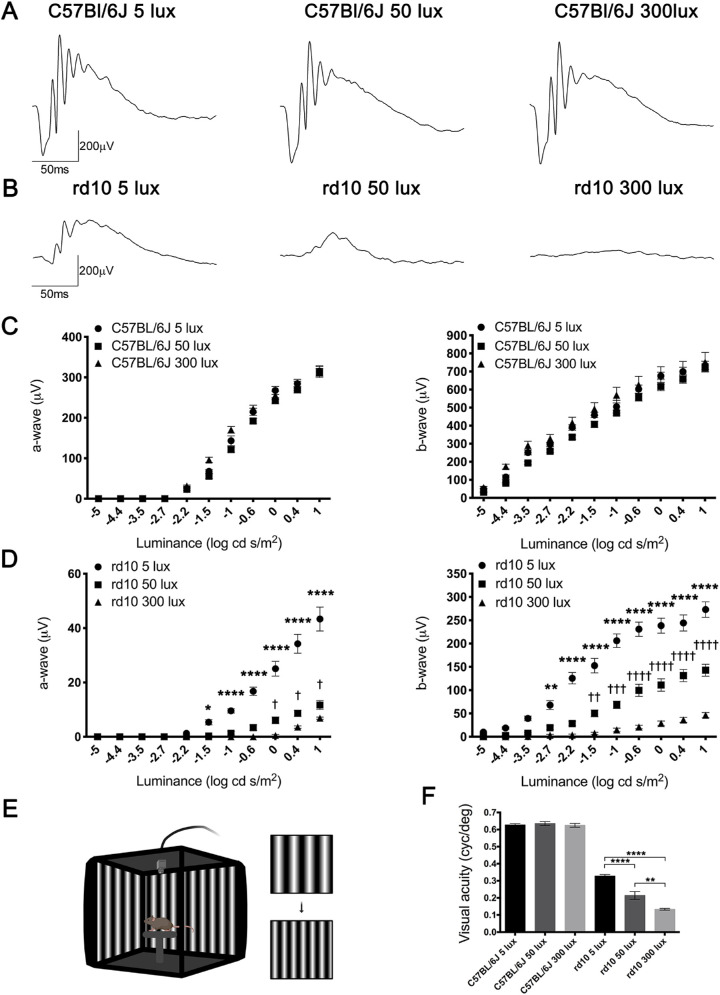
Effect of environmental light conditions on retinal function. (A, B) Representative dark-adapted ERG intensity responses to 1 log cd·s/m2 flashes from C57BL/6J (A) and rd10 mice (B) reared under 5, 50, and 300 lux cyclic light. (C, D) Luminance–response curves of P30 C57BL/6J (C) and rd10 mice (D) housed at the different light conditions (n = 5 to 9). Each graph includes measurements for mixed a-wave (left graphs) and b-wave (right graphs) responses. (E) Configuration of the optomotor system. Image was created using BioRender (https://biorender.com/). (F) Visual acuity measured as the spatial frequency threshold in C57BL/6J and rd10 mice reared at 5, 50, and 300 lux (n = 4 to 9). Two-way (ERG) and one-way (optomotor test) ANOVA and Tukey's post hoc test. *P < 0.05, **P < 0.01, ***P < 0.001, ****P < 0.0001 for comparisons between animals housed at 50 and 300 lux. †P < 0.05, ††P < 0.01, †††P < 0.001, ††††P < 0.0001 for comparisons between animals housed at 5 and 50 lux.

