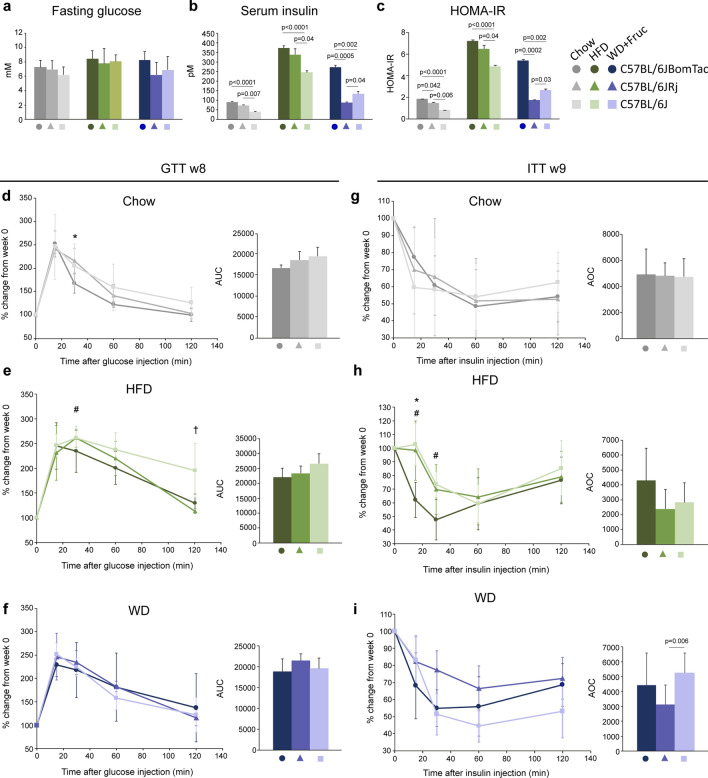
Figure 4.
Glucose and insulin levels and tolerance test after eight to nine weeks of high-fat diet feeding. (a) Fasting blood glucose, (b) serum insulin, and c) HOMA-IR in C57BL/6JBomTac (filled circle), C57BL/6JRj (filled triangle), and C57BL/6J (filled rectangle) on chow, HFD, and WD + Fructose after 10 weeks of diet intervention. (d–i) Glucose and insulin tolerance test, shown in percentage change from week 0, in C57BL/6JBomTac (filled circle), C57BL/6JRj (filled triangle), and C57BL/6J (filled rectangle) on (d, g) chow, (e, h) HFD, and (f, i) WD + Fructose (left) and AUC/AOC (right) after eight or nine weeks of diet intervention. Data is presented as mean ± SD. Statistical significance is calculated using two-way ANOVA with n = 4–6. P-values for a-c) are shown in the figure. Significance (d–i) is indicated comparing the different strains p < 0,05 (*) C57BL/6JRj (filled triangle) vs C57BL/6JBomTac (filled circle), (#) C57BL/6J (filled rectangle) vs. C57BL/6JBomTac (filled circle) or (†) p < C57BL/6JRj (filled triangle) vs. C57BL/6J (filled rectangle).

