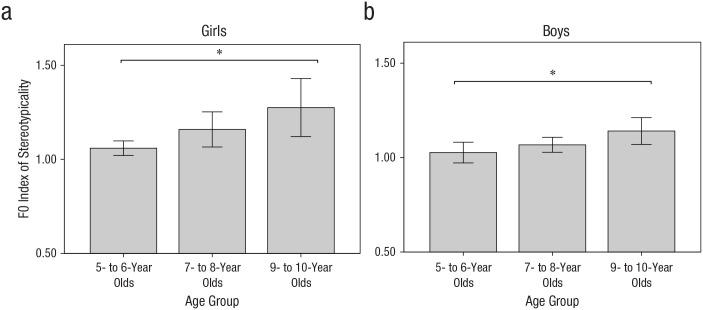
Fig. 4.
Fundamental frequency (F0) index of stereotypicality (F0 across the feminine occupations divided by F0 across the masculine occupations) for girls (a) and boys (b) within each age group. Absence of stereotyping is reflected by index values equal to 1, and increasing levels of stereotyping is reflected by index values above 1. Asterisks indicate significant differences between age groups (p < .05). Error bars represent 95% confidence intervals.

