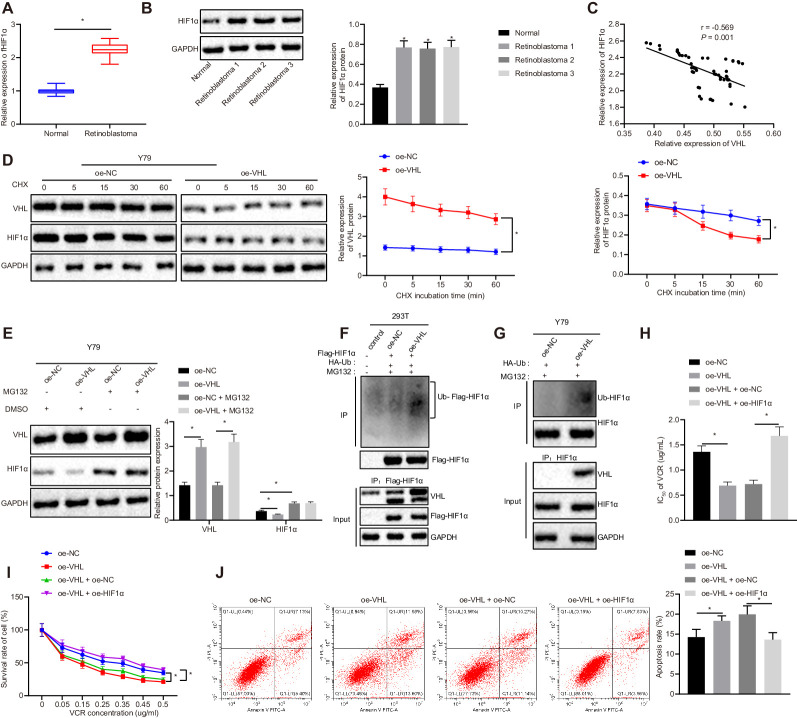
Figure 3.
VHL reduces the resistance of RB cells to VCR by decreasing of the stability of HIF1α. (A) Normalized expression of HIF1α in retinal tissues of RB patients (n = 50) and normal retinal tissues (n = 17) examined by RT-qPCR assay. (B) Expression of HIF1α in retinal tissues of RB patients (n = 50) and normal retinal tissues (n = 17) determined by western blot analysis. (C) Pearson's correlation analysis between HIF1α and VHL. (D) Expressions of VHL and HIF1α in transfected Y79 cells treated with 100-µM CHX measured by western blot analysis. (E) Expression of VHL and HIF1α in transfected Y79 cells treated with 40-µM MG132 determined by western blot analysis. (F) Effect of VHL on HIF1α ubiquitination in 293T cells detected by IP assay. (G) The effect of VHL on HIF1α ubiquitination in Y79 cells assessed by immunoprecipitation assay. (H) The IC50 of VCR on transfected Y79 cells examined by MTT assay. (I) Cell survival rate of transfected Y79 cells measured by MTT assay. (J) Apoptosis rate of transfected Y79 cells analyzed by flow cytometry. In A and B, *P < 0.05 versus normal retinal tissues. In D, *P < 0.05 versus oe-NC transfected Y79 cells. In E, *P < 0.05 versus oe-NC and oe-NC transfected Y79 cells. In F to J, *P < 0.05 versus oe-NC or oe-VHL + oe-NC group. Measurement data are expressed as mean ± SD. Data comparisons between two groups were performed by unpaired t-test. Statistical analysis in relation to time-based measurements within each group was conducted using repeated-measures ANOVA followed by a Bonferroni's post hoc test. Pearson's correlation coefficient was used to analyze the relationship between VHL and HIF1α. The experiment was conducted in triplicate.

