Figure 4.
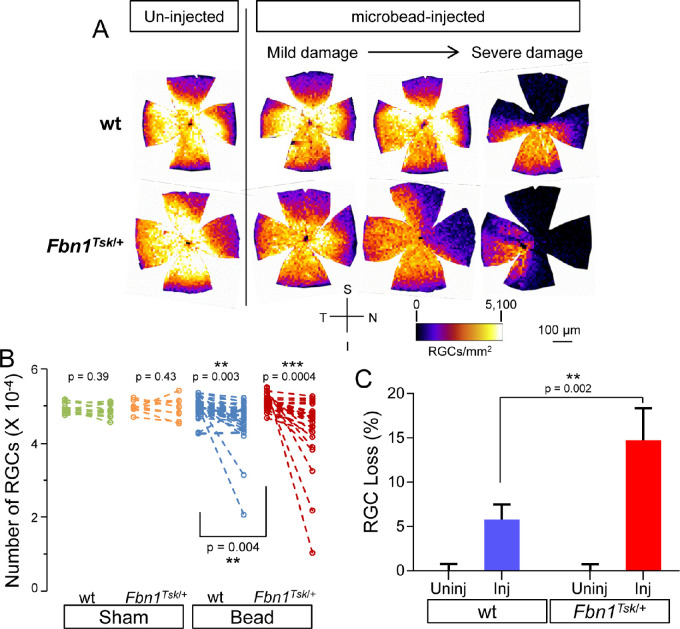
RGC loss in response to microbead injection. Heat maps of RGC density (A) show that compared to retinas from un-injected eyes (left column), microbead injection resulted in decreased RGC density in wt (top row) and Fbn1Tsk/+ mice (bottom row) with variability between individual mice ranging from mild to severe damage, as well as lower densities in the superior and nasal quadrants. Analysis (B) comparing uninjected (left symbols) with bead-injected eyes (right symbols) showed significant loss of RGCs for wt (blue symbols) and Fbn1Tsk/+ mice (red symbols) but not for sham-injected controls (green and orange symbols). The average percent RGC loss relative to the average number of RGCs in uninjected eyes (C) was lower for wt (blue bar) as compared with Fbn1Tsk/+ mice (red bar). Orientation of retinal whole mounts (S: Superior, N: Nasal, I: Inferior and T: Temporal) and heat map density scale are shown (A). Numbers of microbead-injected animals: 43 wt and 26 Fbn1Tsk/+: sham-injected: 12 wt and 10 Fbn1Tsk/+. Dashed lines connect paired eyes (B).

