Figure 5.
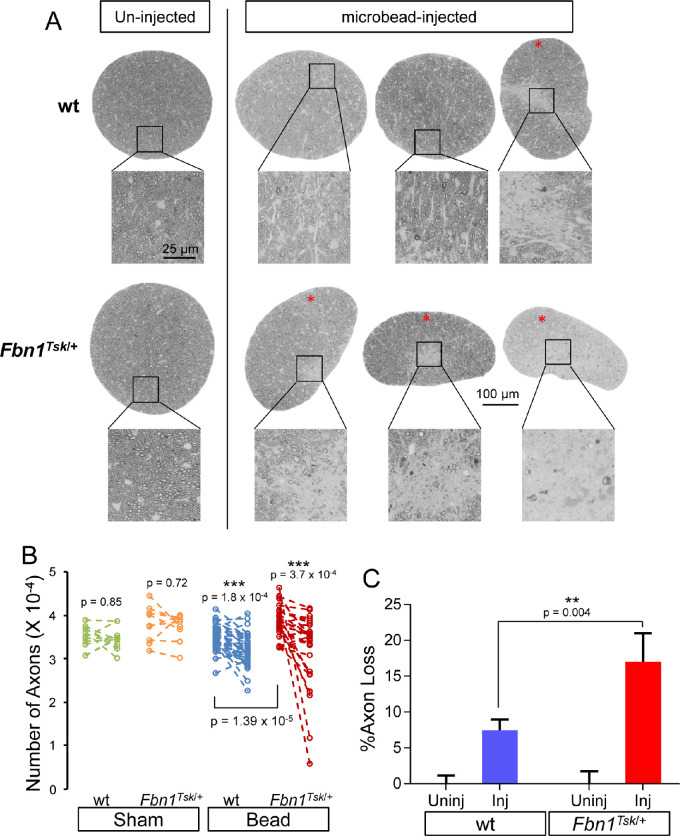
RGC Axon loss in response to microbead injection. Images of optic nerve cross-sections (A) show that compared to nerves from uninjected eyes (left column), microbead injection results in focal axon loss in some nerves (red asterisks), more commonly in Fbn1Tsk/+ mice. Paired analysis (B) comparing uninjected (left symbols) with bead-injected eyes (right symbols) showed significant loss of axons for wt (blue symbols) and Fbn1Tsk/+ mice (red symbols) but not for sham-injected controls (green and orange symbols). The average percent axon loss relative to the average number of axons in un-injected eyes (C) was lower for wt (blue bar) as compared to Fbn1Tsk/+ mice (red bar). Numbers of microbead-injected animals: 43 wt and 29 Fbn1Tsk/+: sham-injected: 12 wt and 9 Fbn1Tsk/+. Scale bar for the whole nerve in A: 100 μm. Dashed lines connect paired nerves (B).

