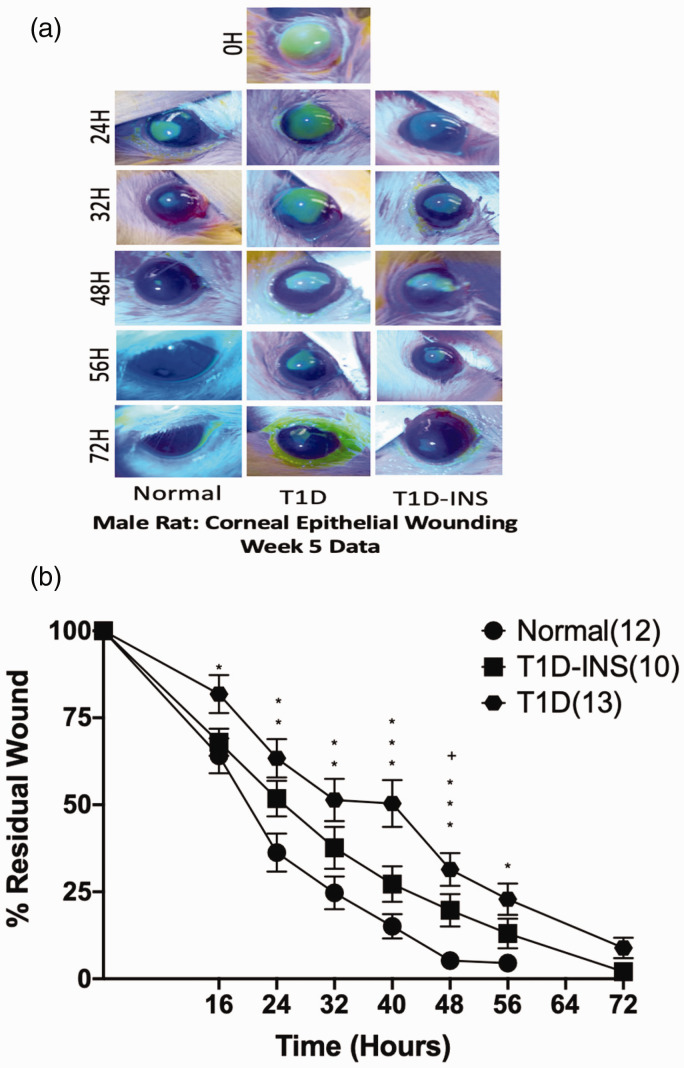
Figure 3.
Photographs (a) and percent residual corneal defects (b) for T1D, T1D-INS, and Normal rats (n= 6–9 animals per group). Eyes were stained with fluorescein strips and photographed prior to wounding (0 h) and at 16, 24, 32, 40, 48, 56, and 72 h after abrasion. Two-factor ANOVA did not reveal a significant interaction with condition, but time was significant with one-factor ANOVA, P < 0.001. Residual areas (means ± S.E.M.) are presented as the percentage of remaining wound relative to the area of the original wound for the same rat. Significantly different from Normal animals at P < 0 05 (*), P < 0.01 (**), P < 0.001 (***); significantly different between T1D and T1D-INS at P < 0.05 (+). (A color version of this figure is available in the online journal.)

