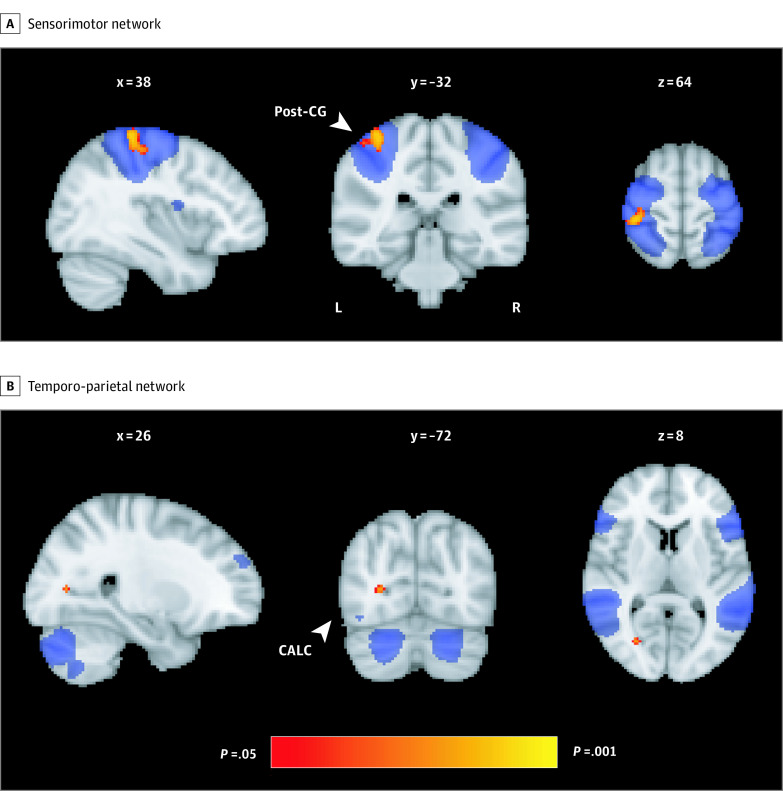
Figure 4. Results of Voxelwise Regressions Between Social Activity Trajectories and Resting-State Functional Connectivity.
A, Negative correlation between quadratic coefficients of social activities and functional connectivity of the sensorimotor network. B, Negative correlation between linear coefficients of social activities and functional connectivity of the temporo-parietal network. These clusters were significant after covarying for age, sex, education, scanner, and head motion and are overlaid on spatial maps of the sensorimotor network (A) and temporo-parietal network (B) and MNI152 template. The x, y, and z coordinates are reported in MNI space (millimeters); these results did not survive false discovery rate corrections. CALC indicates intracalcarine cortex; post-CG, postcentral gyrus.

