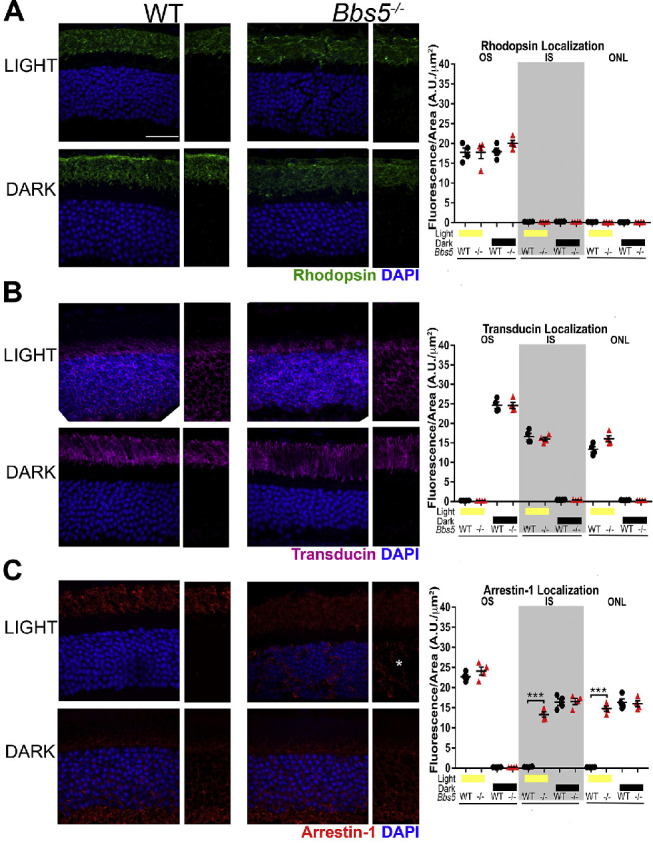
Figure 3.

Analysis of rod cell phototransduction protein localization in Bbs5–/– retinas. (A) Rhodopsin staining (green) in both light- and dark-adapted conditions reveals normal localization to the outer segment in 2M Bbs5–/– and WT mice. (B) Transducin staining (magenta) is similar between Bbs5–/– and WT controls in both the light and dark conditions. (C) Arrestin-1 staining (red) is present in the outer segment and is mislocalized to the inner segment and outer nuclear layer in the light-adapted Bbs5–/– retinas (asterisk) but has normal localization in dark adapted conditions. One-way ANOVA was used for quantification of the average fluorescence intensity distribution, as indicated for each protein in the graphs (***P < 0.05). DAPI-stained nuclei are blue. *Areas of mislocalization. Scale bar: 25 µm.
