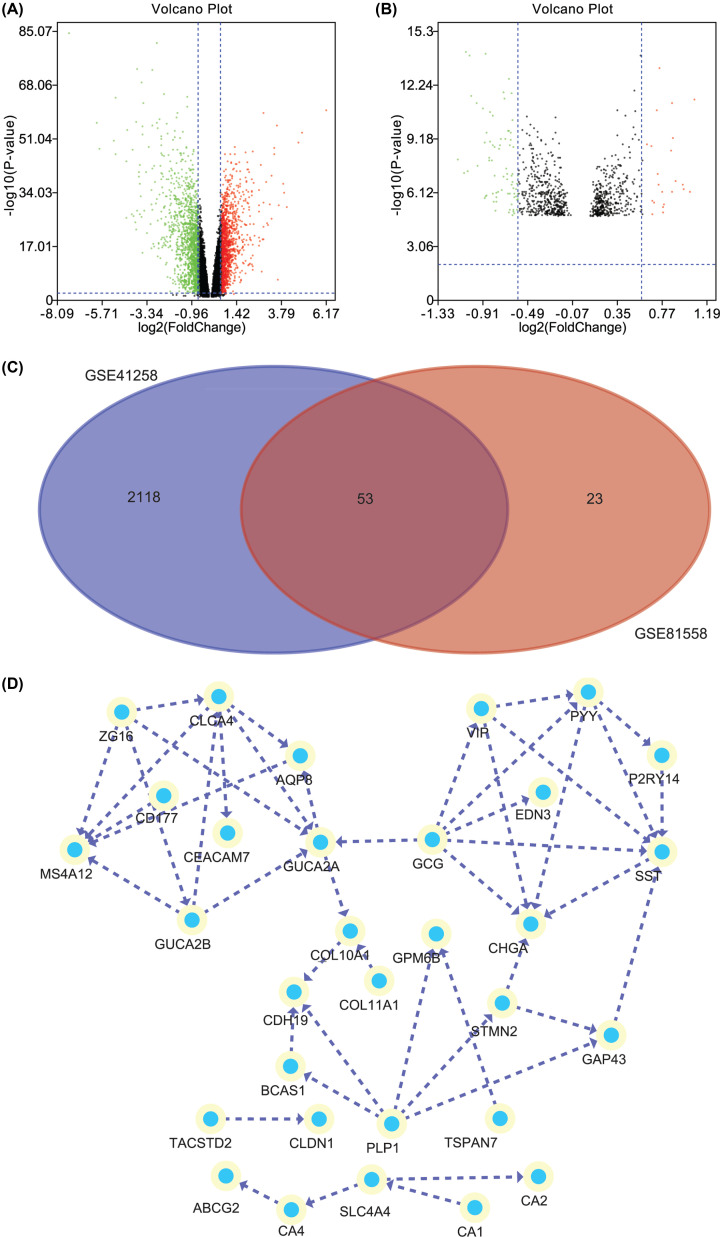
Figure 1. The differently expressed genes and PPI network.
(A) One volcano plot presents the DEGs in the GSE41258. (B) Another volcano plot presents the DEGs in the GSE81558. In the volcano plots, the green nodes indicate the down-regulated DEGs, and the red nodes indicate the up-regulated DEGs. (C) The Venn diagram manifested that a total of 53 DEGs were exist in the two datasets (GSE41258 and GSE81558) simultaneously. (D) The PPI network of the common DEGs.

