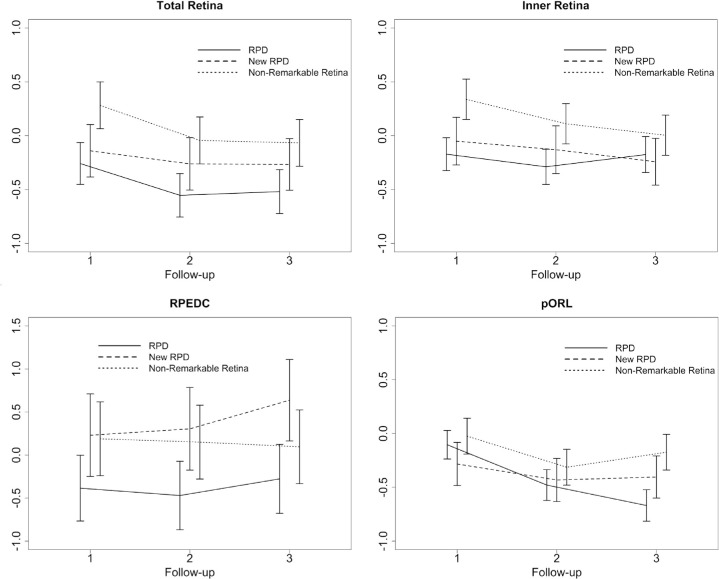
Figure 2.
Graphical illustration of the longitudinal thickness changes in SD of the control group of the total retina, the inner retina, the RPEDC, and the pORL thickness. For each of the four layers, the changes are shown for the three different groups: (a) regions of existing RPD at baseline, (b) regions of newly developing RPD, and (c) in non-remarkable regions of the retina. Data of the retinal thickness change were plotted in normative SD. The x-axis shows the number of the follow-up visit.

