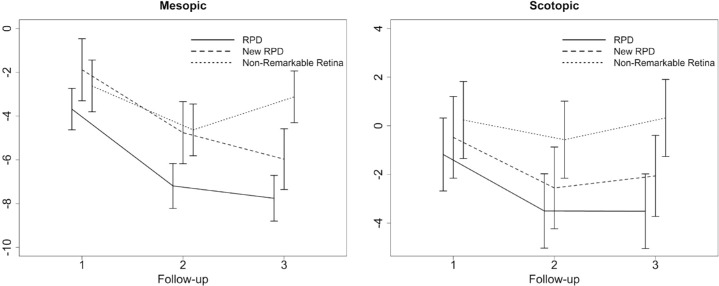
Figure 4.
Graphical illustration of the longitudinal sensitivity changes [estimate ± standard error] in dB for mesopic and scotopic FCP testing at each follow-up visit (FU 1–3). Results are presented for retinal regions with RPD, newly developing RPD at follow-up visit, and regions with nonremarkable pathological alterations.

