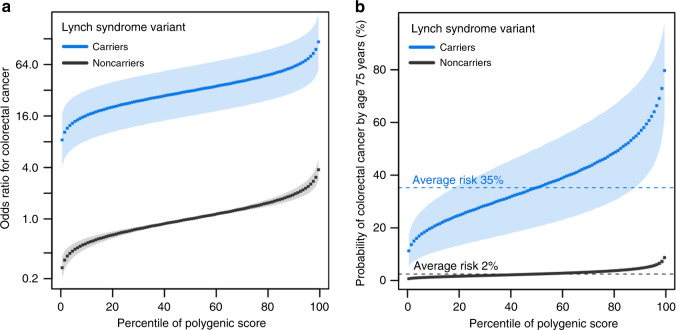
Fig. 3. Interplay of monogenic and polygenic risk for colorectal cancer.
a Predicted odds ratio for colorectal cancer in each percentile (dots) of the polygenic score distribution for carriers (blue) and noncarriers (black) of Lynch syndrome variants in the cohort study derived from the UK Biobank (n = 48,812). Noncarriers with median polygenic score served as the reference group. b Predicted probability of colorectal cancer by age 75 years in each percentile (dots) of the polygenic score distribution for carriers (blue) and noncarriers (black) of Lynch syndrome variants in the cohort study derived from the UK Biobank (n = 48,812). The shaded area around the dots represents the 95% confidence interval. The horizontal dashed lines show the probability of disease for people with average polygenic risk score.

